
Housing Market Review – Stocks Racing Away From Swirling Data
The last Housing Market Review covered data reported in September, 2017 for August, 2017. At the time, I described a growing rift between the data and the stocks of home builders. Instead of stumbling, housing stocks received a fresh breath of life and kicked up the momentum another notch higher in October. The iShares U.S. Home Construction ETF (ITB) has not been this high since early 2007.
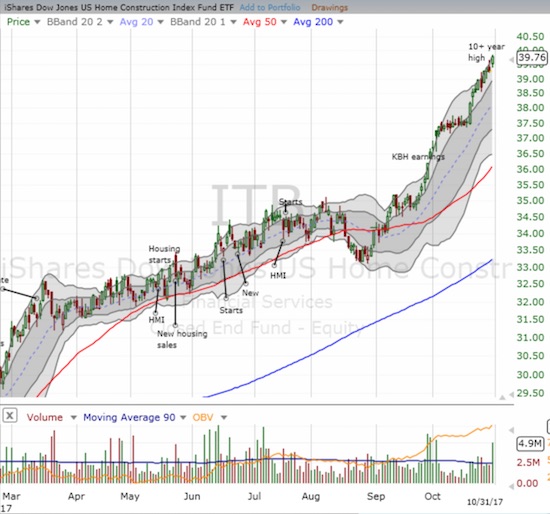
The iShares US Home Construction ETF is up a breathtaking 13.1% since it broke out to new highs in early September.
Source: StockCharts
The rally in home builders is broad-based. The regional builders have benefited greatly. For example, Century Communities (CCS) quickly recovered from its struggles in August to now trade at a fresh all-time high. With hindsight, I clearly gave up on CCS too soon to lock in profits. More importantly, I can see now that the August dip was the opportunity to play the seasonally stronger period for housing stocks (November to spring).
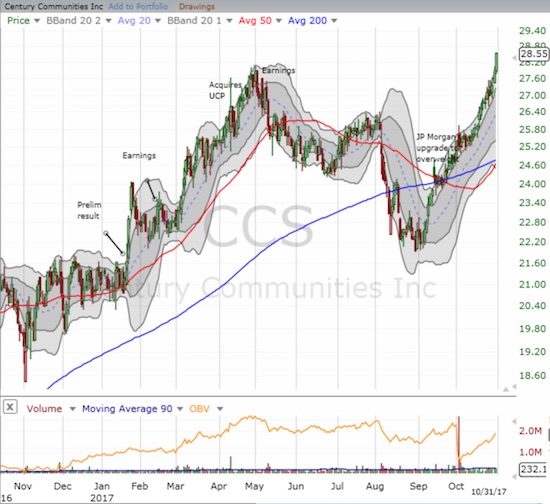
Century Communities made an impressive recovery from August’s steep slide and the April/May peak.
Source: StockCharts
LGI Homes (LGIH) set new all-time highs throughout October. The stock is up 110% year-to-date!
While the stock gains are impressive and the earnings reports continue to look good, I cannot help taking a pause when looking at the macro-housing data. Price gains seem too relentless, existing home sales stand in stark contrast to soaring new home sales, and home builder sentiment is racing ahead of starts. This “curious” mix of data does not motivate me to chase after home builder stocks at current levels. So, for now, I am mainly observing the action. More on this in my concluding “parting thoughts.”
New Residential Construction (Housing Starts) – September, 2017
Single-family housing starts for August were revised upward from 838,000 to 869,000. September starts decreased month-over-month by 4.6% to 829,000. On an annual basis, single-family housing starts increased 5.9%, well below last month’s 17.1% year-over-year jump. These data bring the year-over-year gains back to a level last seen for February, 2017. Since then, year-over-year gains were at or close to double-digits.
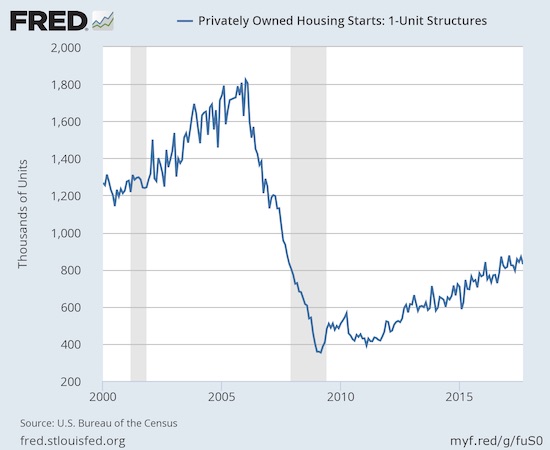
Housing starts remain in an uptrend but the year-long cap means that the trend has slowed a bit.
Source: US. Bureau of the Census, Privately Owned Housing Starts: 1-Unit Structures [HOUST1F], retrieved from FRED, Federal Reserve Bank of St. Louis, October 22, 2017.
After three months of wide deviations, the regional changes were more uniform for the previous three months. Wide deviations returned for September with some impact from the hurricanes in the Southern region. The Northeast, Midwest, South, and West each changed 17.7%, 10.5%, -5.6%, and 26.1% respectively in September. For August these percentages were, respectively, 26.9%, -2.7%, 22.8%, and 14.6%. The strong starts in the West are quite consistent with the very bullish sales results reported from the West by KB Home (KBH).
Existing Home Sales – September, 2017
The routine description for existing sales is usually sales decline because of a shortage of inventory and sales increase in spite of inventory shortages. For September, 2017, hurricanes Harvey and Irma seemed to dampen sales but sales declined year-over-year in the Northeast and Midwest as well as the South. Moreover, during its conference call, the NAR noted a 4% year-over-year increase in sales in hurricane-impacted Houston. The NAR speculated that investors rushed in to buy distressed homes. Yet, this explanation was not available for Florida where existing home sales plunged 22% year-over-year.
Overall sales managed a small monthly increase and ended three straight months of declines. Since sales increased on a monthly basis, the boilerplate complaint from the NAR was couched in sales growth:
““Realtors® this fall continue to say the primary impediments stifling sales growth are the same as they have been all year: not enough listings – especially at the lower end of the market – and fast-rising prices that are straining the budgets of prospective buyers.”
For January 2017, existing home sales rose to levels not seen since February, 2007. In February 2017, existing home sales dropped sharply and rebounded sharply in March to a new post-recession high. Now, sales are on the decline and even went negative year-over-year in September.
The seasonally adjusted annualized sales of 5.39M were up 0.7% month-over-month from 5.35M in sales for August (a second straight month without a revision). Year-over-year sales decreased 1.5% consistent with a recent pattern of deceleration since April: November 15.4%, December 0.7%, January 3.8%, February 5.4%, March 5.9%, April 1.6%, May 2.7%, June 0.7%, July 2.1%, August 0.2%. So September’s annual drop, the first since last August, essentially confirms a top in sales for 2017.
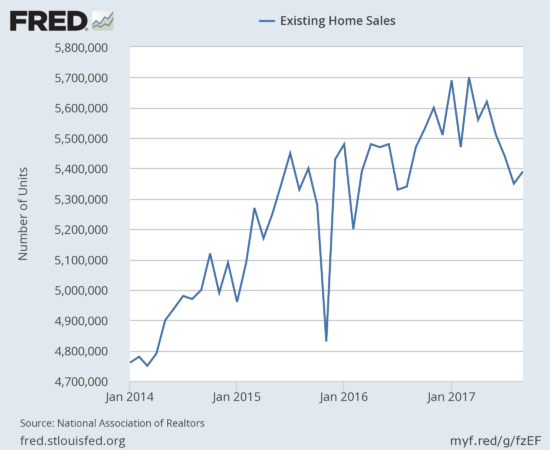
Existing home sales finally ended an extended monthly decline.
(recall that the NAR no longer makes data available before 2013. For more historical data to 1999 click here)
Source: National Association of Realtors, Existing Home Sales© [EXHOSLUSM495S], retrieved from FRED, Federal Reserve Bank of St. Louis, October 30, 2017.
First-time buyers dropped to 29% from 31%. This decline was the first below 30% since September, 2015. Year-to-date this share was stuck in the low 30s. The average for 2016 was 35%. I wonder whether hurricane-impacted areas have a higher share of first-time buyers, but the NAR did not speculate beyond the standard affordability explanation:
“Nearly two-thirds of renters currently believe now is a good time to buy a home, but weakening affordability and few choices in their price range have made it really difficult for more aspiring first-time buyers to reach the market…”
Regardless, combined with the deceleration in sales growth, a decline in first-time homebuyers provides reasons for concern and something to watch going forward.
The absolute level of inventory of existing homes fell year-over-year for the 28th straight month. Recall that during the June press conference, the NAR talked about a housing crisis in supply in some housing markets. The 1.90M homes for sale represented a 6.4% decrease from the previous September although it is an increase from August’s 1.88M. The string of year-over-year declines has been remarkable: starting from 2016…August -10.1%, September -6.8%, October -4.3%, November -9.3%, December -6.3%, January -7.1%, February -6.4%, March -6.6%, April -9.0%, May -8.4%, June -7.1%, and July -9.0, August -6.5%.
In December, inventory hit 3.6 months of sales and a new absolute low measured from 1999 when the NAR began tracking. At 4.2 months of sales, relative inventory stayed even with July and August but was down from the 4.5 months a year ago.
Investors purchased 15% of existing homes in September, the same as August and September a year ago. As I note every month, investor appetite is far from satiated.
For August, the regional sales performances show an incremental impact from the hurricanes as the South lagged all regions: Northeast -1.4%, Midwest -1.5%, South -2.3%, West 0.0%. All regions logged year-over-year price jumps even with the flat to declining sales: Northeast 4.8%, Midwest 5.4%, South 4.6%, West 5.0%.
September’s 4.2% year-over-year increase in the overall median price of an existing home remarkably represents the 67th consecutive month of year-over-year increases. The median price of of $245,100 is down from August’s $253,500 and a drop below the previous record of $252,800 set in May.
Single-family sales increased 1.1% on a monthly basis and decreased on a yearly basis by 1.2%. The median price of $246,800 was up 4.2% year-over-year; the past five months have delivered similar year-over-year gains.
“Single-family home sales climbed 1.1 percent to a seasonally adjusted annual rate of 4.79 million in September from 4.74 million in August, but are still 1.2 percent under the 4.85 million pace a year ago. The median existing single-family home price was $246,800 in September, up 4.2 percent from September 2016.”
New Residential Sales – September, 2017
New single-family home sales declined in July steeply enough to threaten a break of the years-long uptrend. August’s hurricane-impacted sales numbers seemed to seal the fate of that uptrend. And then September happened: despite broad-based declines in existing home sales in September, new home sales soared on both a year-over-year and month-over-month basis.
The Census Bureau revised August sales of new single-family homes downward from 571,000 to 561,000. New home sales for September soared 18.9% month-over-month and jumped 17.0% year-over-year to 667,000. While the monthly percentage gain was the highest since 1992, the year-over-year gain was only the highest since March of this year.
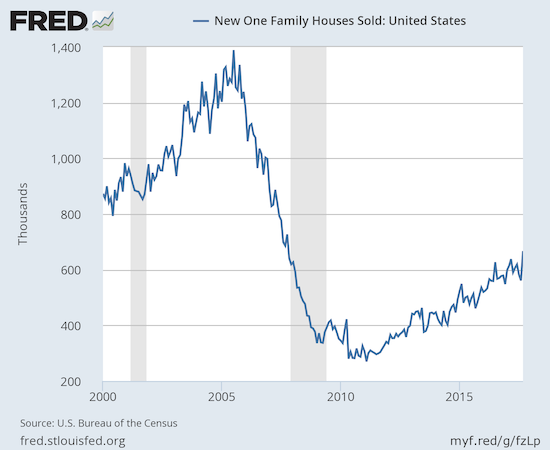
New home sales jumped in one month form the bottom of the uptrend’s range to the top of the channel.
Source: US. Bureau of the Census, New One Family Houses Sold: United States [HSN1F], retrieved from FRED, Federal Reserve Bank of St. Louis, October 30, 2017.
Sales were so robust that new home inventory plunged from 6.1 months of supply to 5.0 months. A market for homes is in balance at 6 months of supply, so the market is suddenly unbalanced all over again. Last month’s inventory was the highest since October, 2011, so perhaps there was pent-up or delayed demand that found relief all at once. Perhaps a downward revision of sales will occur for the next report. Apparently economists were caught by surprise with expectations for a DROP of 0.9% (month-over-month?).
The median price of $319,700 is a significant jump from August’s (revised) $303,800, but is much closer to July’s (revised) $323,600 and up 1.5% year-over-year. Instead of being a point of potential concern, August’s dip now seems like one of those random blips that occurs from time-to-time.
On a regional basis, new home sales continued to exhibit highly divergent behavior. The Northeast experienced its second month of sharply higher sales with a 54.8% year-over-year gain (compare to 65.2% for August). The Midwest declined slightly by 2.7%. The South surged 23.1% which might explain the bulk of the surprise in the new home sales numbers: the South was down 9.2% the previous month as hurricanes seemingly impacted sales. I am reminded of the last earnings conference call from KB Home (KBH) where management noted that its communities in Houston escaped relatively unscathed from Hurricane Harvey and thus gained incremental interest from people looking to buy away from vulnerable areas. The West gained a modest 4.4% year-over-year.
Home Builder Confidence: The Housing Market Index– October, 2017
In March, builder confidence soared to a new 12-year high at 71. The HMI remains stalled just under that 12-year high. October’s reading of 68 delivered a 4 point rebound from September’s level. The National Association of Home Builders (NAHB) flagged the recent hurricanes for weighing on sentiment last month, but this month the NAHB attributed the sharp rise to a recovery in sentiment. Concerned that builders may already be forgetting about the potential impact of the hurricanes on labor availability and material costs, the NAHB issued this caution: “…builders need to be mindful of long-term repercussions from the storms, such as intensified material price increases and labor shortages.”
The NAHB’s caution is an interesting contrast to the optimism expressed last month that the rebuilding process would send sentiment back to the levels of the Spring selling season. At that time, I was skeptical that the rebuilding process would bring optimism and instead expected the experience to highlight the shortages. So I find it interesting that the NAHB has done a turn-around on this theme, especially given the organization complained about shortages BEFORE the hurricanes hit.
All three components of the Housing Market Index (HMI) turned upward. In particular, the single-family components jumped back to or near recent highs. The traffic of prospective buyers barely budged for the month. With consumer sentiment jumping to levels last seen in early 2004, suddenly the odds of HMI hitting a new 12+ year high this year improved significantly (much to my surprise!)
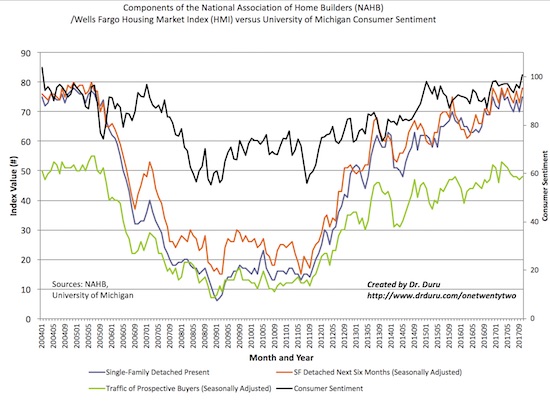
Home builder sentiment turned upward as consumer sentiment hit a near 14-year high.
Source: NAHB
For May and June, there was an interesting disparity in the regional changes in HMI. In May, the West finally broke out from the flatline of the previous 4 months with a 80 reading. The West plunged in June back to 71 to a near 1-year low. For July, the West increased to 74 and for August it came within 1 month of the high from May. The South made the most improvement with an over 10% pop back to within 1 point of the year’s high of 71. In the previous month, I thought the September disparities confirmed a top for the year for HMI. Yet, in October, surges in the Midwest and, surprisingly, the South, helped bring HMI back to life. I would have expected the West to lead the way but instead it declined by 3 points. The Northeast continued to languish as it stayed flat with September’s 50 reading.
Parting thoughts
The seasonally stronger period for home builder stocks begins in November, but I find myself with little appetite to buy. These stocks have soared at various points in the last four months of so and left me with few attractive entry points. I now face the prospect of missing an entire annual cycle of buying and selling these stocks. While I am FAR from bearish, nothing in the data motivates me to chase these stocks.
This situation is a bit ironic. I started on the journey of bullishness on housing as the market was carving out its trough and betting on an imminent rebound seemed foolish. Now, standing aside from housing stocks looks foolish!
The near parabolic chart of my last home builder stock says it all (note I am still holding Invitation Homes Inc. (INVH), a company which manages rentals for single-family homes). Regional builder Tri Pointe Group (TPH) received a standing ovation for its last earnings report and is now up an amazing 33.0% since it last broke out above its 50-day moving average (DMA) just over a month ago. Instead of buying more, I will be looking to lock in profits!
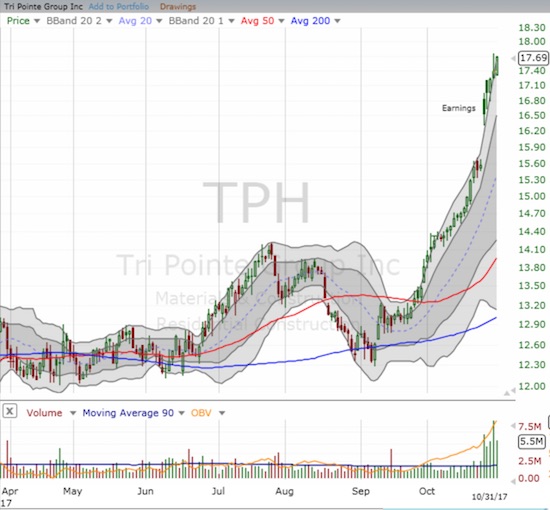
Tri Pointe Group has exploded higher over the past month.
Source: FreeStockCharts.com
In a case of classic poetry, I made my hedged play on KB Home (KBH) call and put options right as the stock came to a screeching halt. While other home builder stocks continue to rally (as can be seen in ITB), KBH is finally taking a rest. The stock has gone nowhere for almost three weeks.
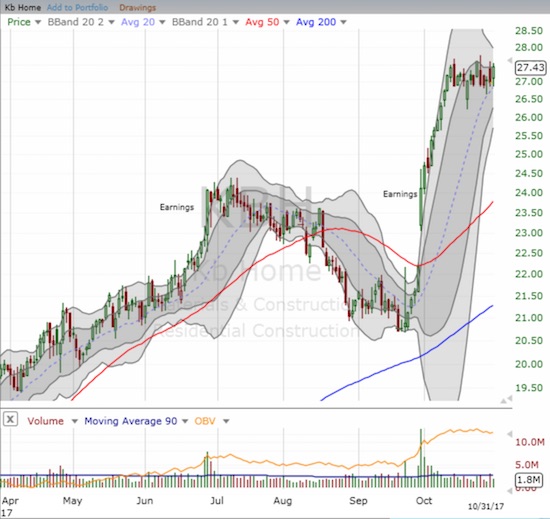
KB Home is on an extended pause after a significant post-earnings repricing.
Source: FreeStockCharts.com
Is it time to give California-heavy Five Point Holdings (FPH) a shot….?
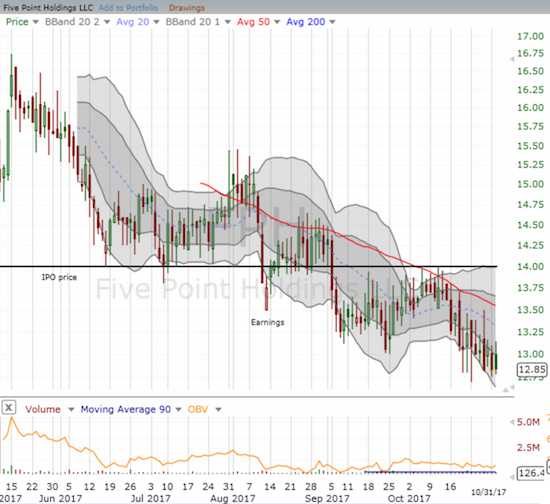
Despite the good housing data in California, Five Point Holdings still broke its IPO price.
Source: FreeStockCharts.com
Five Point Holdings goes public from CNBC.
Disclosure: long TPH, INVH
Follow Dr. Duru’s commentary on financial markets via more


