
Housing Market Review – A Holding Pattern Despite Soaring New Home Sales
The last Housing Market Review covered data reported in July for June, 2016. At the time, a disappointing GDP report sharply rejected the iShares US Home Construction ETF (ITB) off a 9-year high. Fortunately, there was very little follow-through to the selling. When ITB rallied strongly on new home sales, the ETF recovered most of its post-GDP losses. Since then, ITB has drifted toward support at its 50-day moving average (DMA).Commentary on monetary policy from Jackson Hole, WY quickly erased the gains from the new home sales report.
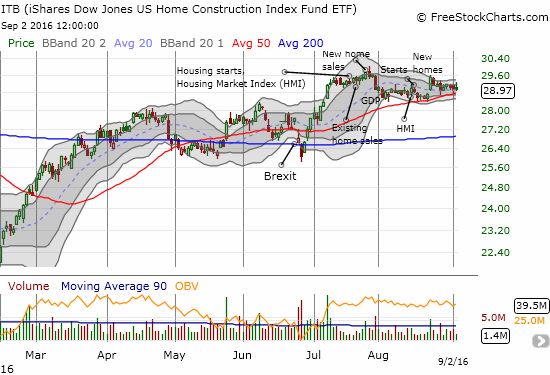
The iShares US Home Construction looks capped by July’s rally.
Source: FreeStockCharts.com
New Residential Construction (Housing Starts) – July, 2016
Another “boring” report on housing starts continued this measure’s stabilization since March’s large drop. Privately owned housing starts for 1-unit structures came in at 770,000 for July. The June 1-unit starts were revised downward to 766,000 from 778,000. This was the third month in a row of downward revisions. The month-over-month change was a gain of 0.5%. The year-over-year growth was 1.3%, a dramatic shift from the previous month’s robust 16.0% year-over-year leap.
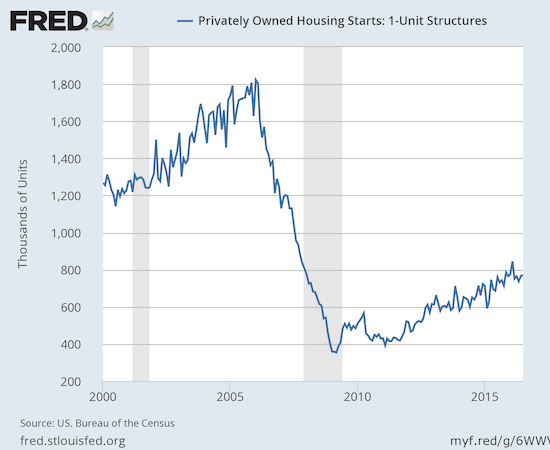
Housing starts continue a path of stabilization after March’s one-month plunge.
Source: US. Bureau of the Census, Privately Owned Housing Starts: 1-Unit Structures [HOUST1F], retrieved from FRED, Federal Reserve Bank of St. Louis, September 3, 2016.
The West returned to a loss. Now two of the last three months have delivered year-over-year drops. The West’s housing starts declined 2.2% from July, 2015. However, unlike previous months, two other regions, the Northeast and the Midwest, suffered year-over-year declines along with the West (-23.9% and -6.7% respectively). Only the South’s return to double-digit year-over-year gains – a jump of 10.0% – prevented housing starts from going negative.
Existing Home Sales – July, 2016
July ended a four-month streak of gains for existing home sales and represented the first year-over-year decline since November, 2015 and only the second such decline in the last 21 months. The seasonally adjusted annualized sales of 5.39M were down 3.2% month-over-month and 1.6% year-over-year. Still, this decline is like a blip compared to current volatility given June’s sales hit a 9-year high.
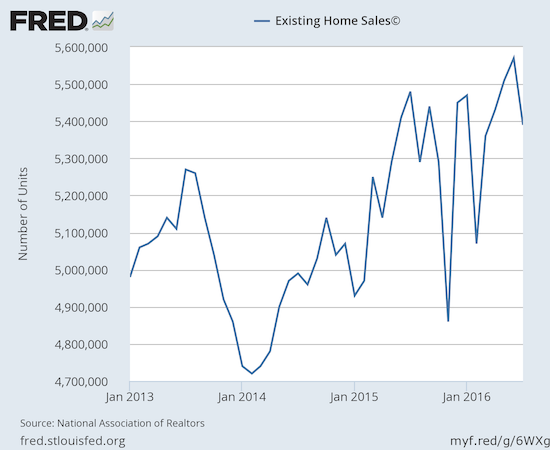
Existing home sales come off a 9-year high.
Source: National Association of Realtors, Existing Home Sales© [EXHOSLUSM495S], retrieved from FRED, Federal Reserve Bank of St. Louis, September, 2016.
I was surprised by the strong reaction from the NAR to this one down month. It made me wonder whether the NAR is worried that this decline is the beginning of something bigger although nothing of the sort was offered as a prediction. The NAR used terms like “fell off track” and “considerable sales slump” to describe the decline. The NAR cited two usual suspects and one new one:
“Severely restrained inventory and the tightening grip it’s putting on affordability is the primary culprit for the considerable sales slump throughout much of the country last month…Realtors® are reporting diminished buyer traffic because of the scarce number of affordable homes on the market, and the lack of supply is stifling the efforts of many prospective buyers attempting to purchase while mortgage rates hover at historical lows.”
Compare this complaint to the previous month when existing sales hit their 9-year high:
“Looking ahead, it’s unclear if this current sales pace can further accelerate as record high stock prices, near-record low mortgage rates and solid job gains face off against a dearth of homes available for sale and lofty home prices that keep advancing.”
The NAR noted a new concern:
“Appraisal-related contract issues have notably risen over the past year and were the root cause of over a quarter of contract delays in the past three months”
During the press conference, NAR chief economist Lawrence Yun placed further blame on regulations that complicate the job of the appraiser and a swell of refinancings that are competing for the time of appraisers. Given the apparent impact of these issues, I am left wondering why the NAR made no reference to it in previous reports on existing home sales.
Investors were again only responsible for 11% of existing sales. This is the lowest share since 9% in July, 2009. Recall that just in February investors bought 18% of existing homes which was the highest share since April, 2014. Whereas part of the previous month’s decline in investor share came from an encouraging increase in first-time homebuyers, first-timers in July purchased 32% of existing homes, down from June’s 33%.
In the previous two months, the West was the only region in the country to experience year-over-year drops in exiting home sales. This time, the West had good company even though it was the only region to gain month-over-month. The West increased 2.5% from May and dropped 0.8% year-over-year. On a year-over-year basis the Northeast fell 5.7%, the Midwest stayed flat, and the South dropped 1.8%. The Northeast was the only region to experience year-over-year gains in median price that printed below 5.0%.
Housing inventory decreased year-over-year again. The year-over-year decline of 5.8% to 2.12M matched June’s percentage drop. Over the previous four months, inventory had greater year-over-year drops. Inventory has now declined year-over-year for 14 straight months. With the drop in sales pace, months of inventory increased from (an adjusted?) 4.5 to 4.7 months of supply. Still, the overall inventory shortage has become a chronic problem in the housing market and reminds us that the market is nowhere close to a “bust” – the sellers are simply too hard to find.
July’s 5.3% year-over-year increase in the median price of an existing home represents the 53rd consecutive month of year-over-year increases. June’s median price across all housing types of $244,100 is a small pullback from June’s record-setting $247,700.
Video length: 00:06:13
New Residential Sales – July, 2016
New home sales were the big headline for the month as they soared to a fresh post-recession high. Perhaps home shoppers were much more enticed by new over existing home sales in July. ITB rallied a healthy 2.6% on the news but, as the above stock chart shows, the ETF still failed to close higher than its post new home sales close in July. I know of no other sector in the stock market where such absolutely and astoundingly good news is so heavily discounted by investors.
New single-family home sales for July increased 12.4% above May’s level and soared 31.3% year-over-year and actually surpassed June’s 25.4% year-over-year increase. The 654,000 new homes sold stretched the current uptrend that started in 2011 and starts a streak of setting of new post-recession highs.
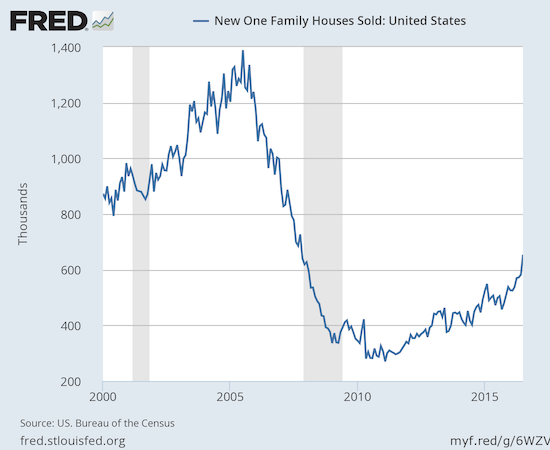
New home sales are FINALLY at levels last seen before the recession.
Source: US. Bureau of the Census, New One Family Houses Sold: United States [HSN1F], retrieved from FRED, Federal Reserve Bank of St. Louis, September 3, 2016.
With sales surging, new home inventory plunged from 4.9 to 4.3 months from June to May. This worsening in the new home inventory levels matches my expectation from the last Housing Review.
The West was a relative laggard again. In the 5 months prior to June, the West had suffered year-over-year decline in sales. In June, sales in the West soared 24.6% year-over-year which placed it third among the regions. July’s 11.4% year-over-year gain significantly lagged the impressive gains in the other three regions: the Northeast, the Midwest, and the South registered year-over-year gains of 25.5%, 35.5%, and 39.6% respectively. I have duly noted that the burst of activity in the South all but confirms that the declines in the oil patch economy are not going to impact the region as a whole (Texas is placed in the South region).
I cannot imagine new home sales continuing the current torrid pace in the coming months. These kinds of gains should be the peak until the next Spring selling season. Accordingly, I will be looking for housing bears to misinterpret softer numbers as a sign of an imminent bust. I am staying in buy-the-dip mode.
Home Builder Confidence: The Housing Market Index– August, 2016
The Housing Market Index (HMI) started the year at 61 and then went four straight months at 58. In June, the HMI came to life again with a jump to 60. For July, the HMI was revised downward from 59 to 58, so August’s 60 reading looks like a fresh jump. Still, the HMI is essentially going nowhere for 2016. The individual components remain the real story. For July, the sentiment regarding future sales, “SF detached next six months,” notably reversed most of its sharp gains from May to June. The two components converged further and have seemingly ended a surprising divergence from earlier months. The two sentiments are typically closely correlated.
In the last Housing Market Review, I wondered whether the sharp dip for sentiment on future sales might also confirm the end of the run for ITB. So far, the two at least seem correlated.

The components of the Housing Market Index (HMI) for current and new sales more than compensate for the decline in future traffic.
Source: The National Association of Home Builders (NAHB)
For August, the Midwest was the sole loser for HMI. The West remained flat while the Northeast and the South gained 2 points. In the last Housing Market Review I wondered whether a two-month streak of gains for the West that diverged from cooling data signaled a trough for the West. So far, so good…
Parting thoughts
I decided to take my remaining profits in my call options on ITB shortly after posting the last Housing Market Review. I concluded that ITB had topped out for now. However, with the start of the seasonal trade in home builders just two months away, I have my buying trigger ready for what should be at least one good sell-off in the next two months (just based on historical volatility).
I had hoped to catch up on a collection of earnings reports for home builders but only knocked off the top of my list with Meritage Homes (MTH). Although the report disappointed analysts, I found a golden nugget in reading that sales in the West are going quite well for MTH. So perhaps, just perhaps, the West has finally bottomed out in its sales data despite the skyhigh prices that beset the region.
The housing data remain relatively strong. I have seen enough positive indicators from the West to take it out the doghouse. I will just remain wary. The biggest story going forward for home builders will be monetary policy. With the market anticipating a rate hike in December, home builder stocks will at best remain in a holding pattern absent some major positive catalyst. The market’s biggest concern with home builders remains the next downturn rather than the next positive step in the housing market’s recovery.
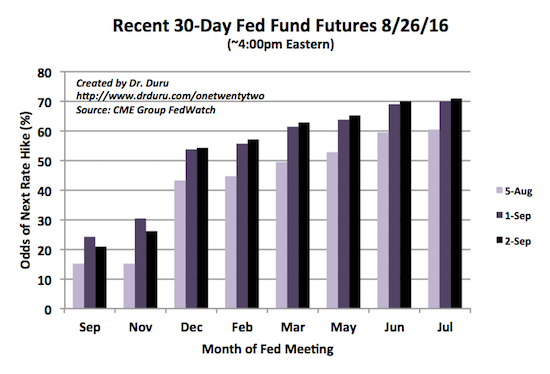
The market favors December for the next rate hike from the U.S. Federal Reserve. The August jobs report nudged those odds higher ever so slightly.
Source: CME FedWatch Tool
Full disclosure: long ITB call options


