
Housing Keeps Getting Worse
Just when you think that housing-related data can’t get any worse, the December report on homebuilder sentiment came in with a big stinker. After last month’s report where the actual level missed expectations by seven points, today’s report for December missed estimates by four points with a reading of 56 compared to expectations of 60. Combining the declines of the last two months, homebuilder sentiment has now dropped by a total of 12 points, which is the second largest two-month drop in the history of the report. Not even during the housing crisis did sentiment drop at this fast of a rate, and the only time it dropped faster was in the two months that followed the 9/11 attacks.
(Click on image to enlarge)
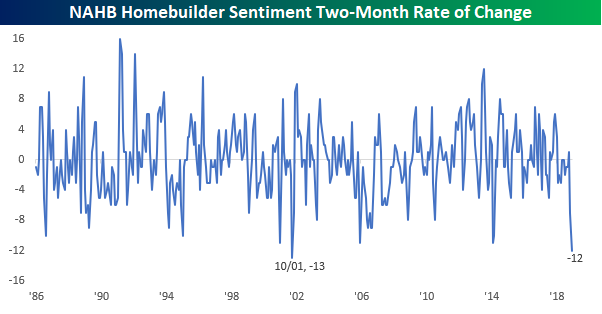
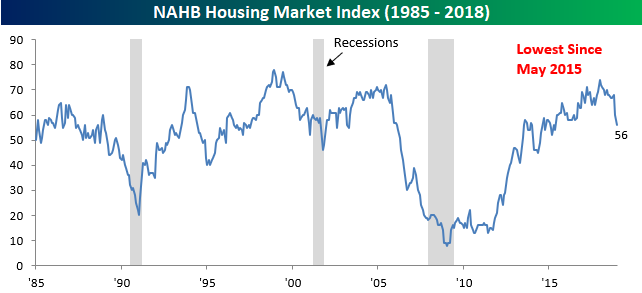
The chart of the actual level of the NAHB Sentiment index doesn’t look pretty either. Following this month’s decline, the index is at its lowest level since May 2015. One thing to take note of with regards to the NAHB Housing Index, though, is that peaks haven’t historically been associated with the onset of recessions. At the start of each of the last three recessions, this index was well past its peak by a matter of years rather than months.
(Click on image to enlarge)
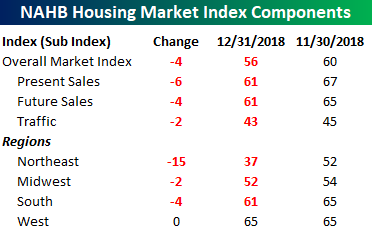
The chart below shows the breakdown of this month’s report by traffic and region. We saw broad-based declines in traffic trends in December, and the bulk of the weakness came in the Northeast. Sentiment in that region dropped by 15 points, which was the largest one month decline since June 2011 and capped off the largest two-month decline on record. It was said a year ago that the Trump tax cuts would have the greatest negative impact on housing in the high tax states of the northeast, and recent data has borne this out.
(Click on image to enlarge)
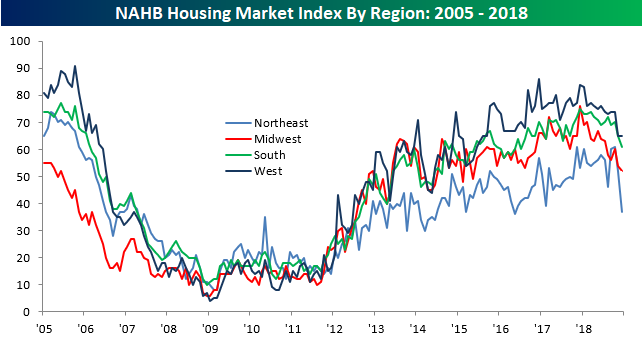
While homebuilder sentiment in the northeast has seen the sharpest declines, the trend is the same around the country- sentiment has peaked.
(Click on image to enlarge)
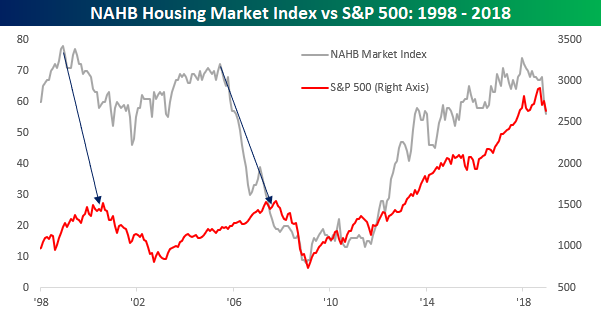
As mentioned above, homebuilder sentiment hasn’t been strongly correlated to trends in the business cycle over time, and with respect to stock market performance, that has been the case as well. Leading up to each of the prior bear markets in the last twenty years, homebuilder sentiment peaked well over a year before the market peak. While not pictured below, we have also seen similar trends play out in prior bear markets since 1985 (when the NAHB survey data begins).
(Click on image to enlarge)
Disclaimer: To begin receiving both our technical and fundamental analysis of the natural gas market on a daily basis, and view our various models breaking down weather by natural gas demand ...
more


China doesn't need to buy USA real estate. Are we winning?