
Home Builder Sentiment Punctuates The Slowdown In The Housing Market
The plunge in sentiment delivered a timely exclamation point to all the other signs of a slowdown I have been observing and describing for much of this year. It stands well by itself without the additional context of the rest of November’s reports on housing data.
In the April housing market review, I explained why I would not have thought much of March’s slight decline in the Housing Market Index (HMI). At 70, the HMI was still higher than it was for most of 2017. For July, the HMI stayed at 68 for the second straight month. However, the HMI dropped another point in August and stayed at 67 for September. For two straight months, the NAHB cleverly called 67 a “solid reading.” I was circumspect about this reading given it was the low for 2018, and I stayed skeptical in the October Housing Market Review even with the HMI increasing by one point at that time. As a reminder, I took the NAHB’s quote as evidence that a housing slowdown was underway (emphasis mine):
“Favorable economic conditions and demographic tailwinds should continue to support demand, but housing affordability has become a challenge due to ongoing price and interest rate increases. Unless housing affordability stabilizes, the market risks losing additional momentum as we head into 2019.”
The slowdown showed up in the November HMI which dropped from 68 in October to 60, the lowest reading since June, 2016. Not only is the 12% drop the largest since an 18% drop in February, 2014, but also the 14% year-over-year plunge is the largest since a 19% year-over-year decline in June, 2011. The last time the HMI hit a low this late in the year was in the depths of the financial crisis. Still, despite all these bad milestones, the 68.1 average HMI year-to-date is still just a bit higher than 2017’s average HMI of 67.8. Thus, the NAHB can find solace in observing: “Despite the sharp drop, builder sentiment still remains in positive territory.” “Positive” means it is above 50. However, clinging to that positive sign is near meaningless since HMI was last below 50 in June, 2014, just two years or so after the housing trough and in the middle of a rapid recovery in sentiment. The components of the HMI would have to suffer significant blows from current levels to drive HMI below 50.
The components of HMI reveal the clearest warning on sentiment. The traffic of prospective buyers soared to a remarkable peak in December, 2017 and has mainly declined from there. November’s drop all the way to 45 makes last year’s top look like a lasting top. Similarly, the other two components of the HMI, single-family detached present and single-family detached six months, have steadily declined for 11 months. A lasting peak in those components is harder to assess because neither component soared as sharply as the traffic of prospective buyers.
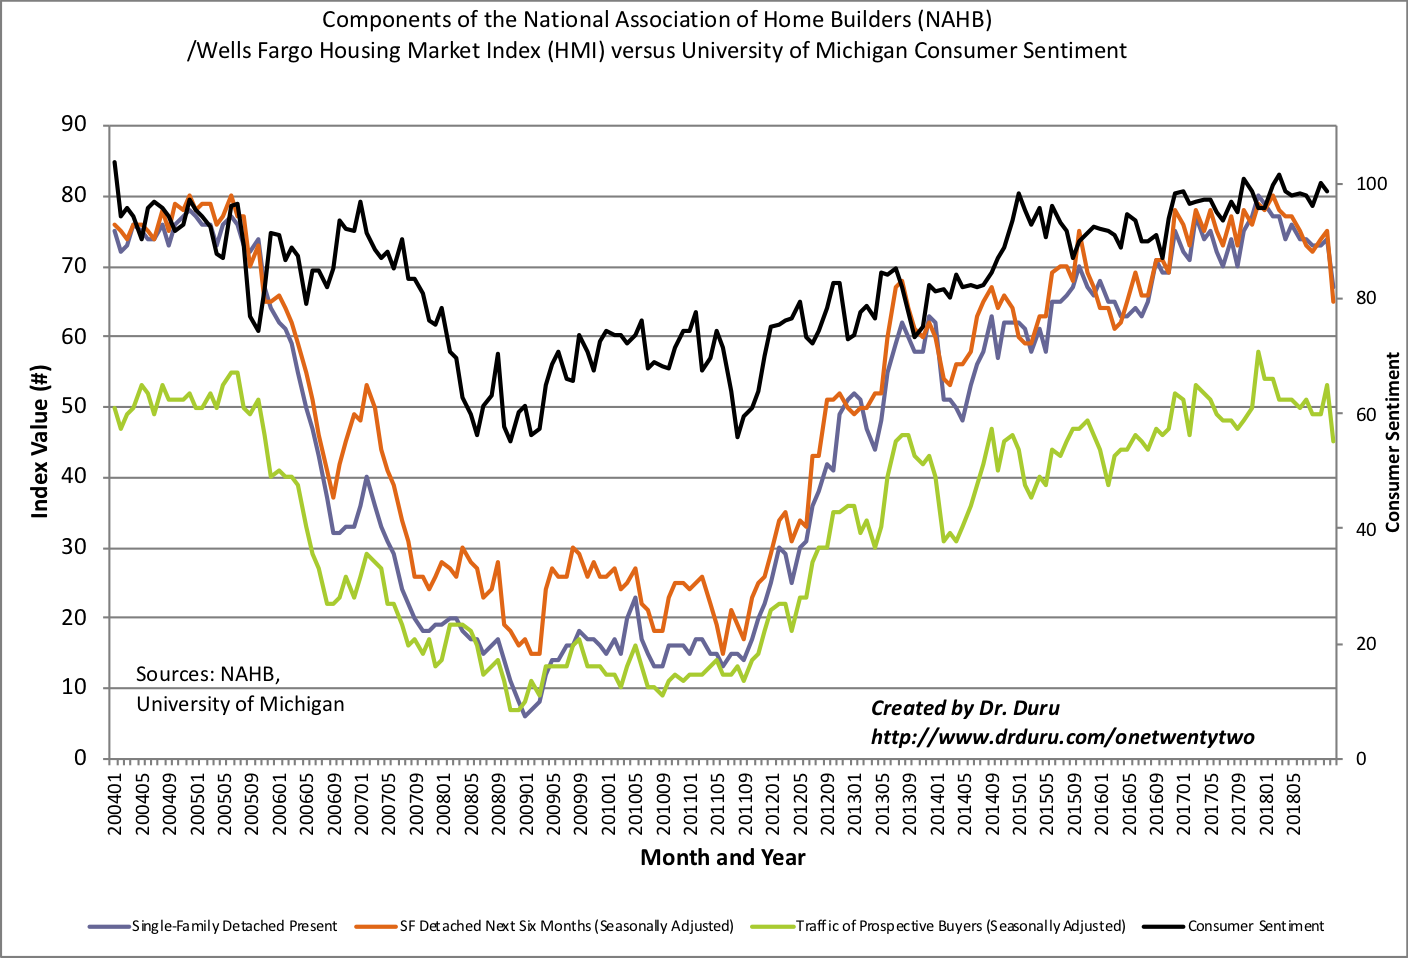
The components of homebuilder sentiment fell sharply across the board. The Housing Market Index (HMI) looks like it hit a lasting peak late last year.
Source: NAHB
The rest of the statement from the NAHB was very telling. I hope the NAHB sent a link directly to the Federal Reserve. The NAHB recommended that “policymakers” start paying more attention to residential housing as a lead indicator on the economy. The NAHB pointed to a 10-year low in affordability and an increase of caution among home buyers and builders alike as causes for concern. The NAHB could have easily copied the following observation from last week’s earnings warning from KB Home (KBH):
“Builders report that they continue to see signs of consumer demand for new homes but that customers are taking a pause due to concerns over rising interest rates and home prices…”
The underlying and unstated implication: the housing market is slowing down and ever higher rates threaten to throw the sector into a full-blown recession. Add housing to the forces steadily boxing in the Fed.
All four regional HMIs declined sharply. Only the Northeast avoided a new low for the year. The Northeast and the Midwest are close to the 50 threshold at 52 and 54 respectively. The Midwest has not been this low since December, 2015. The South hit a 14-month low. The West is the worst region on a relative basis with a reading of 65 that was last seen in September, 2015.
In the October Housing Market Review, I claimed that home builder sentiment would be a key tell in the coming months. In the September Housing Market Review, I concluded that HMI had to begin a recovery in October for me to look forward more optimistically to the seasonally strong period for homebuilder stocks (November through March/April). Unfortunately, I concluded that “…home builder sentiment still looks like a breakdown in slow motion.” The brakes are now off, the breakdown is in full effect and it picked up speed in a hurry. Amazingly, the iShares US Home Construction ETF (ITB) held steady on a day where the S&P 500 (SPY) dropped 1.7% and the Nasdaq plunged 3.0% to a new 7-month low. Is it possible that 2018’s stubborn sell-off in ITB finally priced in the worst of the coming news for the housing market?
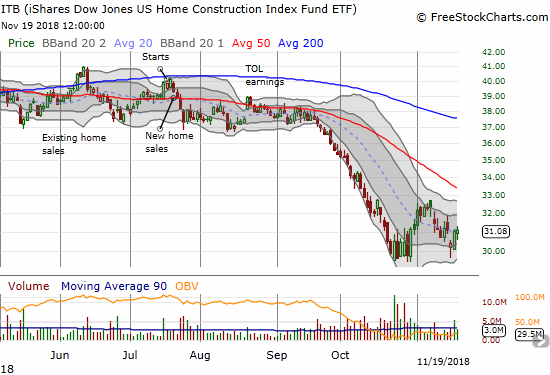
The iShares US Home Construction ETF (ITB) stayed flat on the day with the rest of the stock market crumbling around it.
Source: FreeStockCharts.com
Disclosure: Long ITB calls.
Follow Dr. Duru’s commentary on financial markets via more


