
Historical Bull And Bear Markets Of The S&P
There’s been plenty of chatter lately about the current bull market becoming the “longest on record”. Below is an updated look at the length of the current bull market compared to past bull markets for the S&P 500.
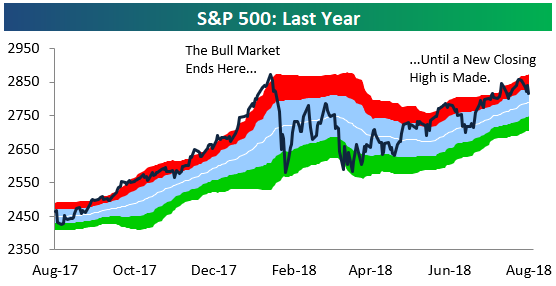
First things first, though. Until the S&P 500 closes at a new high, January 26th, 2018 represents the end point of the current bull market because that’s the date of the S&P’s highest closing point of the bull market. Thus, the length of the current bull market has been stopped at 3,245 days since January 26th (3/9/09-1/26/18). A bull market is most commonly defined as a 20%+ rally that was preceded by a 20%+ decline. If the S&P never closes above its January 26th closing level, and instead it goes on to fall 20% from that level, a new bear market will have begun with a start date of January 26th, 2018. Since we don’t know whether the S&P will go into a new bear market before it closes above its 1/26 high, or vice versa, we can’t extend the length of the current bull market past the 1/26 high point.
(Click on image to enlarge)
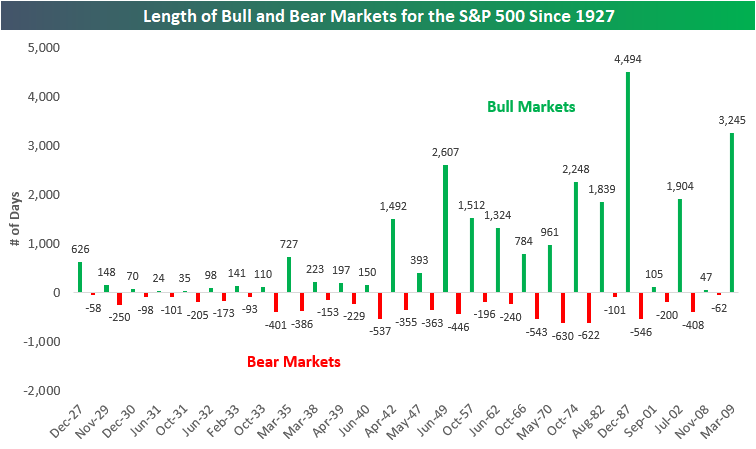
Based on the most commonly used definition of bull and bear markets (20% rallies and declines using closing prices), below is a chart showing the length (in calendar days) of bull and bear markets for the S&P 500 since 1927. We’ve shaded bull markets in green and made them positive, while we’ve shaded bear markets in red and made them negative.
The current bull market that has lasted 3,245 days is the second longest on record behind the 4,494-day bull market that ran from late 1987 through early 2000. Yes, the S&P 500 went from late 1987 to early 2000 without experiencing a single decline of 20% or more on a closing basis.
If the S&P 500 went on to make a new closing high today, the current bull market would be at 3,447 days, which would still be more than 1,000 days less than the longest bull market on record. For the current bull to become the longest on record, the S&P 500 would need to move above its 1/26 closing high and then not experience a 20% decline from an all-time high through June 29th, 2021.
Two things stand out the most in the chart below. The first is that bull markets last a lot longer than bear markets. Indeed, the average bull market since 1927 has lasted 981 calendar days, while the average bear market has lasted 296 days. The second is that US bull/bear market cycles became much longer lasting post-WW2.
(Click on image to enlarge)
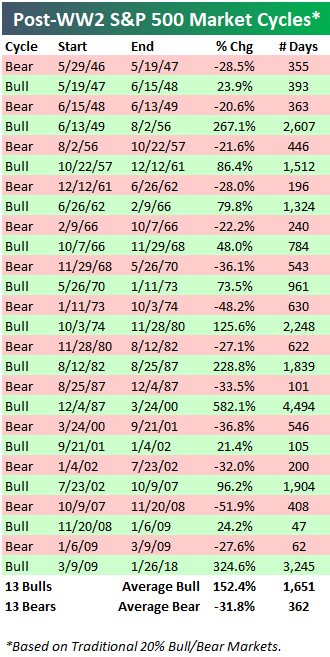
Below is a table showing the 13 post-WW2 market cycles for the S&P 500. The average bull market since WW2 has lasted 1,651 days and seen a gain of 152.4%. The average bear market has lasted 362 days and seen a decline of 31.8%. The current bull market’s gain of 324.6% over 3,245 days is more than double the length and strength of the average bull market.
(Click on image to enlarge)
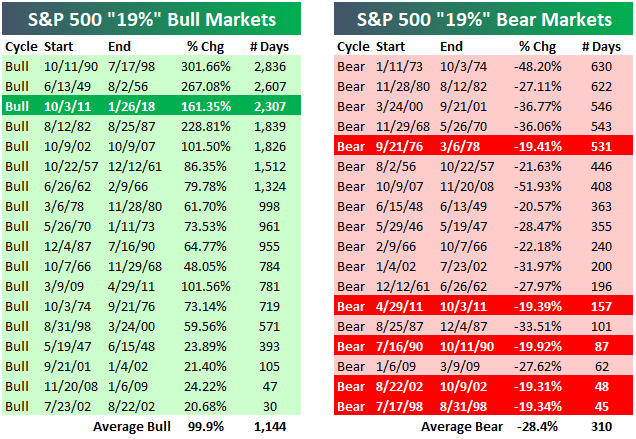
There is always a lot of debate about the 20% rally/decline definition of a bull market. That’s because there have been multiple 19%+ declines from a closing high that just didn’t quite make it to the 20% threshold for a new bear market. Shouldn’t the 19.92% decline back in 1990 be considered a bear market since the index was just 0.08% away from the 20% threshold? Or shouldn’t the 19.39% decline seen in 2011 be considered a bear as well?
We try to be as consistent as possible with the data, so we’re always going to use some type of percentage threshold to measure bull and bear markets over time instead of trying to be subjective about them. And we would never try to say that one 19%+ decline should be considered a bear market while another 19%+ decline shouldn’t be. So for those that would rather use a 19% threshold for market cycles instead of the standard 20% threshold, below, we offer a side-by-side comparison of the two.
As you can see, the 19%+ threshold ends up adding 5 more bull and bear markets to the tally in the post-WW2 era.
(Click on image to enlarge)

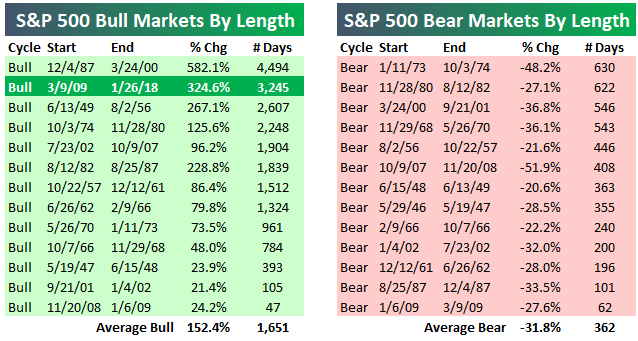
As mentioned earlier, the current bull market is the 2nd longest on record using the standard 20% threshold for bull and bear markets.
If we use the 19% threshold, the current bull would rank as the third longest on record instead of the second longest.
(Click on image to enlarge)
(Click on image to enlarge)
At Bespoke, we’ll likely always use the 20% rally/decline threshold as our definition for bull and bear markets. For investors out there that prefer to be subjective about it or include some 19% declines, that’s fine too!
In regards to the current bull market, even if you include the 19% selloff in 2011 as its own bear market, the bottom line is that this bull has still been a really long one.
There are two things to remember, though, for the time being.1) As mentioned above, the current bull is actually not aging at this point until it takes out its January 26th high. And 2) — more importantly — bull markets don’t die of old age.


