
Higher Rates Are Crushing Investors
There is an old saying that proclaims, “it’s not the size of the ship, but the motion of the ocean.” Since this is a family-friendly publication, we will leave it at that. However, the saying has a connotation that is pertinent to the bond market today. Much of the media’s focus on the recent surge in yields has been on the absolute increase in numerical terms. The increase in rates and yields, while important, fails to consider the bigger forces that can inflict pain on bond holders, or sink the ship. When losses accumulate and fear of further losses mount, volatility and other instabilities can arise in the bond market and bleed to other markets, as we are now beginning to see in the equity markets.
Since 1983, fixed-income investors have been able to put their portfolios on autopilot, clip coupons and watch prices rise and yields steadily fall. Despite a few bumps on this long path, which we will detail, yields, have declined gradually from the mid-teens to the low single digits.
In this piece, we discuss the effect that higher yields are having on debt investors today and compare it to prior temporary increases in yield. It is from the view of debt investors that we can better appreciate that the “motion” is much bigger today than years past.
The Motion of the Bond Ocean
As we alluded in the opening, the losses felt by bond investors cannot be calculated based solely on the amount that yields rise. For instance, if someone told you that yields suddenly rose by 1%, you have no way of estimating the dollar losses that entails for any investor or the entire universe of bond holders. For example, an investor holding a 1-month Treasury bill will have a temporary and inconsequential loss of less than 0.10%, but it will be erased when the bill matures next month. Conversely, a holder of a 30-year bond will see the bond’s value drop by approximately 20%. This example demonstrates why a bond’s duration is so important. In addition to duration, it is critical to know the cumulative amount of bonds outstanding to understand the effects of changes in yields or interest rates.
Comparing yield changes to prior periods without respect for duration and amount of debt outstanding is a critical mistake and has led to an under-appreciation of the losses already incurred by the recent rise in rates and the potential future losses if rates increase further. The importance of this analysis comes back to the central premise of an investor’s objective – wealth is most effectively compounded by avoiding large losses. In the end, we care less about the change in interest rates than we do the impact of that change on the value of a portfolio.
Amount of Debt Outstanding: Since 1993 total U.S. debt outstanding, including federal government, municipalities, consumers, and corporations have risen from about $14 trillion to nearly $60 trillion, a 318% increase as graphed below. The table below the graph compares the surge in outstanding debt among the various issuers of debt as well as the nation’s GDP.
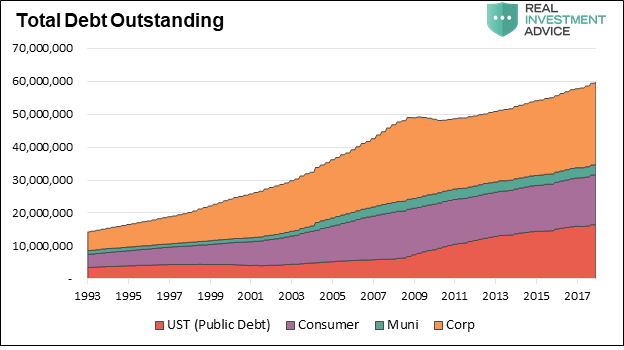

Data Courtesy: Bloomberg
Duration of Debt Outstanding: The duration of a bond is a measure of the expected change of a bond’s price for a given change in yield. For example, the U.S. Treasury 10-year note currently has a duration of 8.50, meaning a 1% change in its yield should result in an approximate 8.50% decline in price. Since it quantifies the price change of a bond for a given change in interest rates, it affords a pure measure of risk. For simplicity’s sake, we omit a discussion of convexity, which measures the second order effect of how duration changes as yields change.
Think of duration as a fulcrum as shown below.

As illustrated, an investor of these cash flows would receive the weighted average of the present value of all of the expected cash flows at the three year mark.
Duration is a function of the current level of yields, the nominal coupon of the security, and the time to maturity of the debt issued.
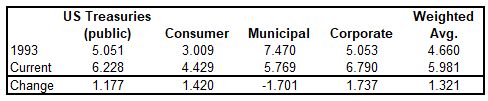
The following graph highlights that the weighted average duration of total U.S. debt outstanding (including Federal, consumer, municipal and corporate) has increased by approximately 1.30 years to almost 6 years since 1993. All else equal, a 1% increase in yields today would result in an approximate 6.0% loss across all U.S. debt versus a 4.7% loss in the early 1990’s.

Data Courtesy: Bloomberg
The table above shows the changes in duration for various classes of fixed-income instruments since 1993. Consumer debt includes mortgages, credit cards and student loans. As an aside, the increase in yields since 2016 has caused the duration of mortgage-backed securities (MBS) to increase by over 3.0 years from 2.25 to 5.30 years.
Duration and Amount of Debt Outstanding
If we combine the duration and debt outstanding charts, we gain a better appreciation for how fixed-income risk borne by investors has steadily increased since 1993. The following graph uses the data above to illustrate the sensitivity of bond investors’ wealth to a 1% change in yields. For this analysis, we use the change in 5-year U.S. Treasury yields as it closely approximates the aggregate duration of the bond universe.
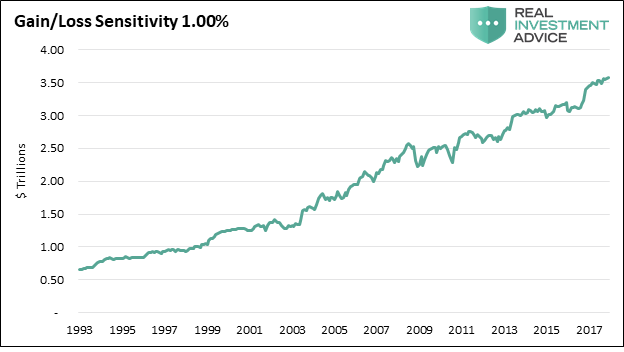
Data Courtesy: Bloomberg
The table below displays the way that the recent uptick in bond yields has been commonly portrayed over the prior few months.

Tables like the one above have been used to imply that the 2.13% increase in the 5-year U.S. Treasury yield since 2016 is relatively insignificant as three times since 1993 the trough to peak yield change has been larger. However, what we fear many investors are missing, is that the change in rates must be contemplated in conjunction with the amount of debt outstanding and the duration (risk) of that debt.
The table below combines these components (yield change, duration, and debt outstanding) to arrive at a proxy for cumulative dollar losses. Note that while yields have risen by only about two-thirds of what was experienced in 1993-1994, the dollar loss associated with the change in yield is currently about three times larger. Said another way, yields would have needed to increase by 9.73% in 1993-1994 to create losses similar to today.

Data Courtesy: Bloomberg
Summary
We have often said that our current economic environment is much more sensitive to changes in interest rates because of the growth in debt outstanding since the financial crisis and the recent emergence from the ultra-low interest rate period that crisis produced. Although 5-year yields have only risen by 2.13% from the 2016 lows, losses, as shown above, are accumulating at a faster pace than in years past.
Furthermore, because of the difference between the amount of debt outstanding and the actual currency in the economic system, most of that debt represents leverage. It is beyond the scope of this article to explore those implications but, as illustrated in the table above, rising rates will decidedly reveal the instabilities we fear are embedded in our economy but have yet to fully emerge.
If we are near the peak in interest rates for this cycle, then unrealized losses are likely manageable despite the anxiety they have induced. On the other hand, if we are in the process of a secular change in the direction of rates and they do continue higher, then nearly every fixed-income investor, household, corporation and the government will be adversely impacted.
Disclaimer: Click here to read the full disclaimer.


