
Here Are The Key Charts You Should Be Watching
I’ve shown many charts over the past few weeks, so I wanted to use today’s post to update them after the Fed’s Jerome Powell took more of a dovish tone regarding upcoming Fed Funds rate hikes, which caused stocks and other risk assets to rally in relief. Surprisingly, none of the important technical breakdowns I showed in recent weeks were negated by this week’s action.
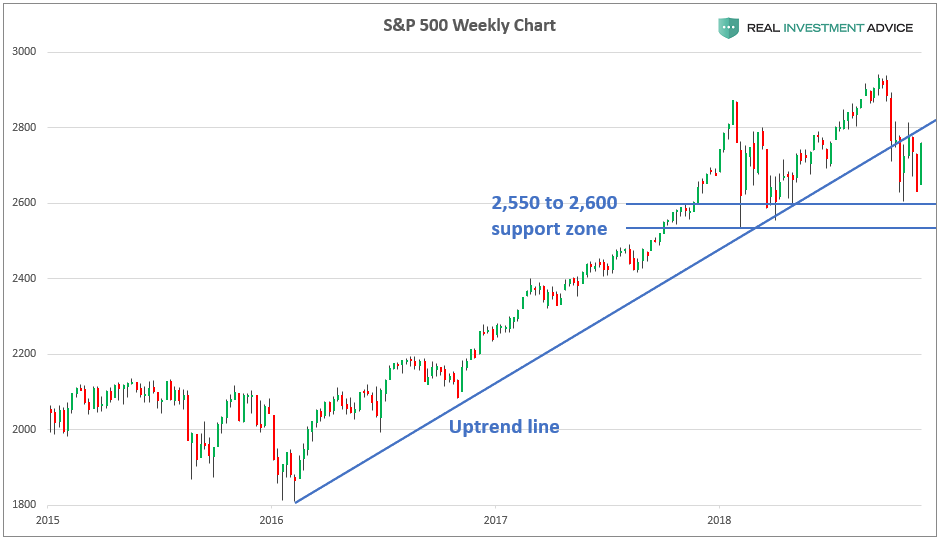
As I’ve been showing since October, the S&P 500 broke below its uptrend line that started in early-2016, which I view as an important technical breakdown. Despite this week’s rally, the index is still below this important level. The S&P 500 is still holding above its 2,550 to 2,600 support zone that formed at the early-2018 lows. If this level is broken decisively, it would give another bearish confirmation signal. As I said one month ago, I am watching if the S&P 500 forms a bearish head and shoulders pattern.
(Click on image to enlarge)
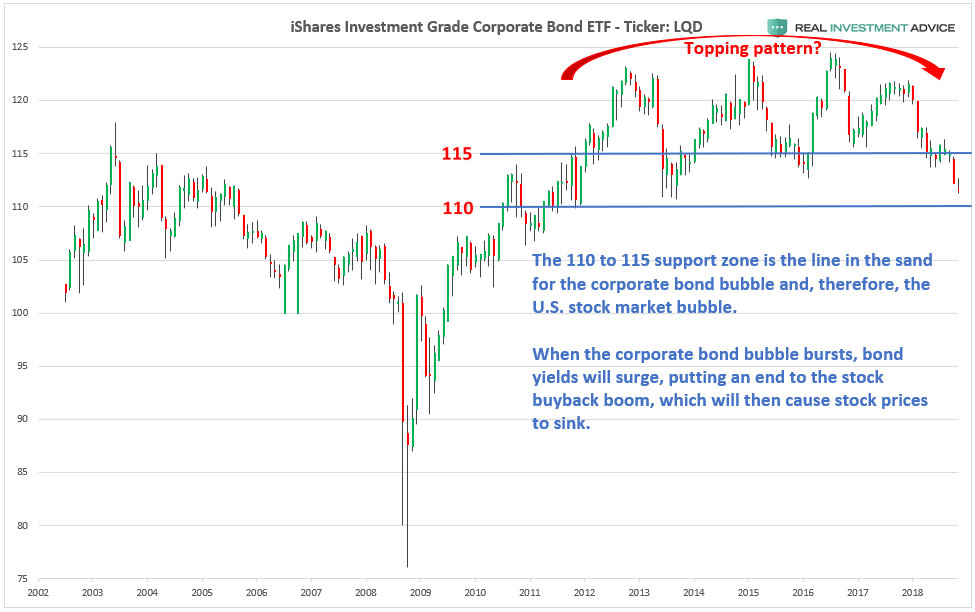
The next chart shows the LQD iShares Investment Grade Corporate Bond ETF. I said that the 110 to 115 support zone is key line in the sand to watch. If LQD closes below this zone in a convincing manner, it would likely foreshadow an even more powerful bond and stock market bust ahead. This week’s action did nothing to change my view.
(Click on image to enlarge)
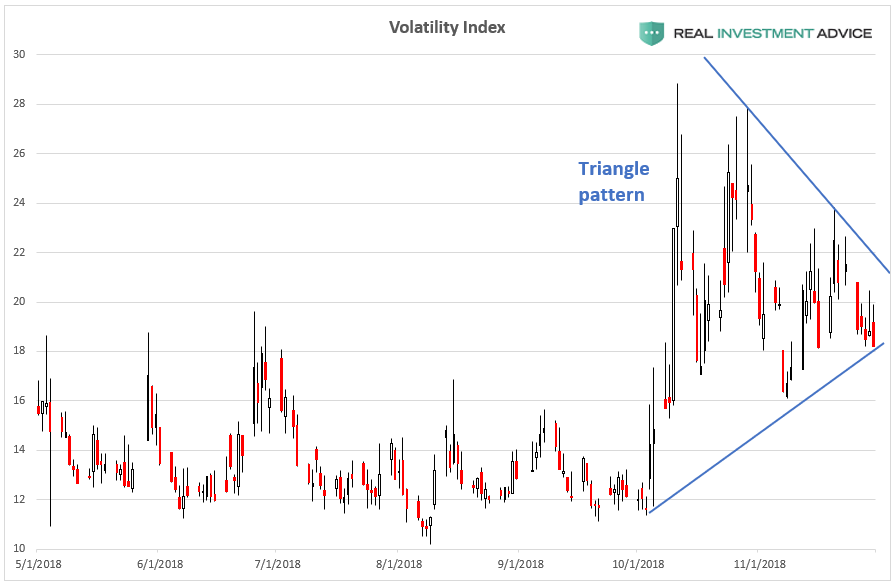
The chart below shows the VIX Volatility Index, which I said appeared to be forming a triangle pattern that may foreshadow another powerful move ahead. If the VIX breaks out of this pattern in a convincing manner, it would likely lead to even higher volatility and fear (which would correspond with another leg down in the stock market). On the other hand, if the VIX breaks down from this pattern, it could be the sign of a more extended market bounce or Santa Claus rally ahead. Interestingly, this week’s market bounce and Powell’s comments did not cause this pattern to break down.
(Click on image to enlarge)
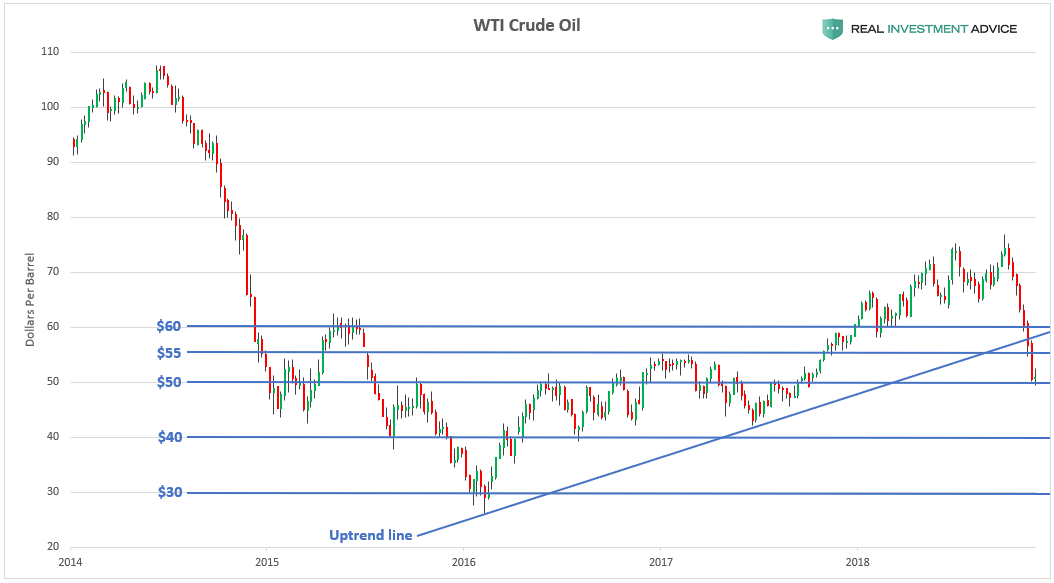
Last week, I showed the key levels to watch in WTI crude oil after its shocking plunge in the past month. I explained that oil broke below its important uptrend line that started in early-2016, which is not a good sign (this breakdown is very similar to the S&P 500’s breakdown). WTI crude oil is sitting right above its key $50 level. A convincing break below $50 would likely signal further bearish action.
(Click on image to enlarge)
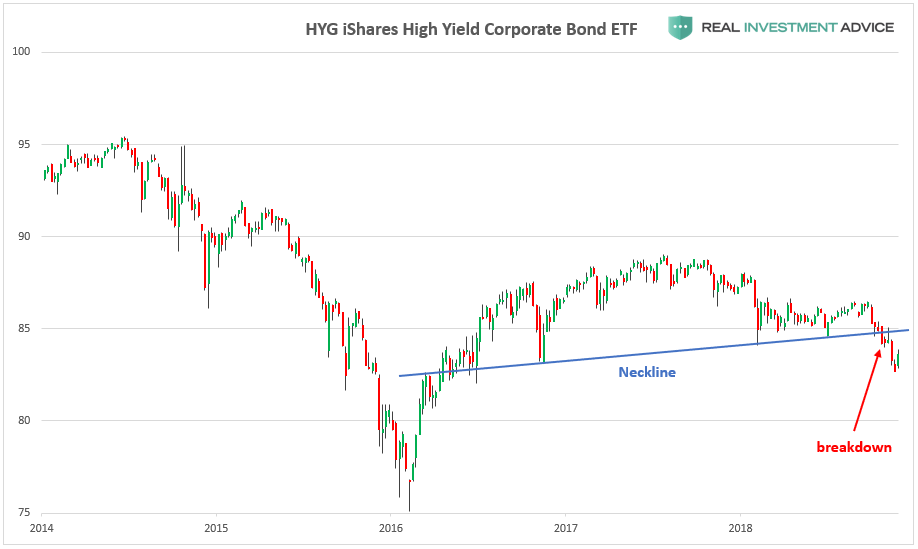
In last week’s crude oil update, I explained that crude oil’s plunge caused an important technical breakdown in the HYG high yield corporate bond ETF (because a good portion of outstanding junk bonds have been issued by shale energy companies). In recent years, bearish moves in crude oil often lead to bearish moves in the HYG ETF and vice versa. I believe HYG’s breakdown is yet another sign that the shale energy bubble is on the verge of popping. This week’s market bounce and Powell’s comments did not negate this bearish breakdown.
(Click on image to enlarge)
I am watching how these markets act at the key levels discussed and I will provide periodic updates when there are important developments.
For the author's full disclosure policy, click here.


