
Has This Important 2016 Stock Signal Flipped?
Signal Said Be Open To Bullish Outcomes
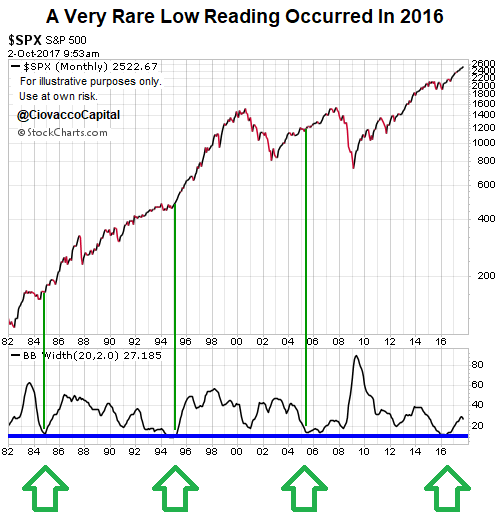
Posts dated September 6 and November 30 of 2016 outlined a rare bullish signal that was flashing based on movement in S&P 500’s monthly Bollinger Bandwidth. From the September 2016 analysis:
“When Bollinger Bandwidth readings hit extremely low levels, it tells us to be open to a big move. The S&P 500’s daily Bollinger Bandwidth has never been lower than it is today, using data back to 1982, which means a big move could be coming soon in stocks.”
From the November 2016 analysis:
“The purpose is not to predict the outcome in 2016, but rather to help us keep an open mind about better than expected outcomes, especially relative to the frustrating and short-lived trends of the past three years.”
Testing The Bullish Theories From 2016
To date, the markets have followed the bullish script outlined by the movements in the S&P 500’s monthly Bollinger Bandwidth in 2016. Therefore, it is prudent to understand the range of historical outcomes from past periods that featured similar setups.
“Take a theory and stick with it. But you also have to be open-minded enough to switch tracks if you feel that your theory has been proven wrong.”
Tony Saliba
Market Wizards
How Long Did Similar Rallies Last?
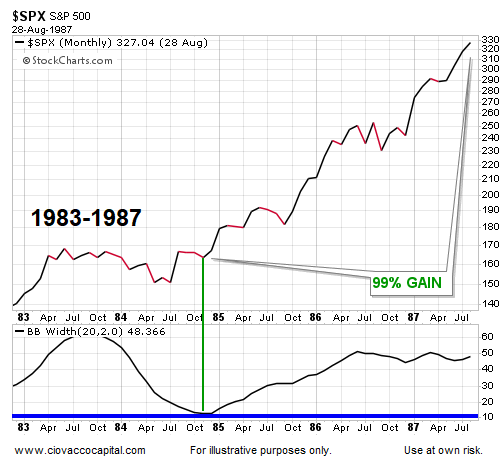
If we look at the chart that was presented in November of last year, we see three similar periods based on extremely low Bollinger Bandwidth readings: 1984, 1995, and 2005. After a similar signal in 1984, the S&P 500 rallied for almost three years posting a gain of 99%.
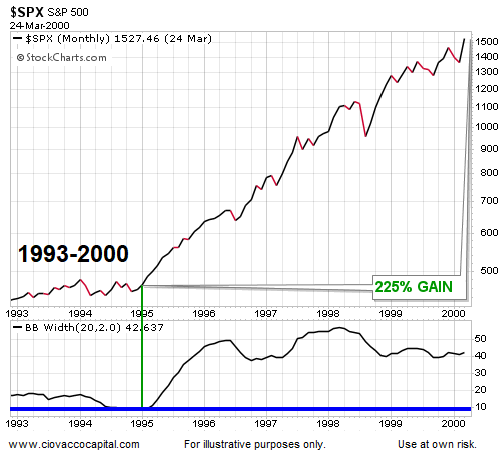
1995 Case
We have noted similarities between 2016-17 and 1994-95 numerous times over the past year, including in a December 2016 post. Bollinger Bandwidth also was flashing a “be open to better than expected outcomes” signal in early 1995. After the bullish setup, the S&P 500 rallied for over five years and tacked on 225%.
Is A Bear Market In Stocks Overdue?
You may have read stocks are currently in the 2nd longest bull market ever, which implies stocks are overdue for a pullback of 20% or more. Are we really overdue for a bear market? What do the facts say? You can decide using the data presented in this week’s video.
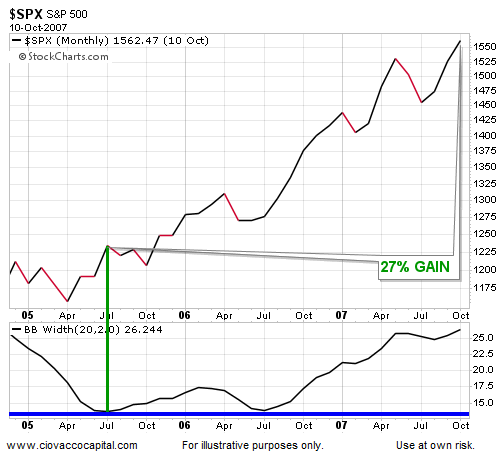
2005 Case
A similar Bollinger Bandwidth setup and bullish turn occurred in 2005. After the “be open to more upside” signal, the S&P 500 rallied for over two years gaining 27%.
How Can All This Help Us?
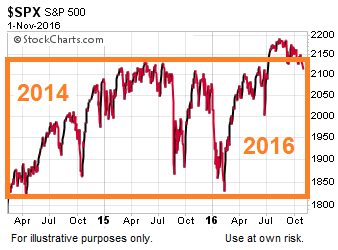
The purpose is not to predict the outcomes in 2017-2018, but rather to help us keep an open mind about better than expected outcomes, especially relative to the frustrating and short-lived trends that were present in the 2014-2016 period.
The charts above simply review the history of low/rare Bollinger Bandwidth readings; nothing more, nothing less. It should be noted we are reviewing a very small sample size.
If 2017 and 2018 fall into the bullish camp, the major U.S. stock market indexes will remain above their recent long-term consolidation boxes, asset class behavior will continue to align with risk-on outcomes, and the current bullish trends will remain in place. If the bears start to work on the previous list, the odds of “bad things happening” will improve. We will continue to take it day by day.
Disclosure: This post contains the current opinions of the author but not necessarily those of Ciovacco Capital Management. The opinions are subject to change ...
more

