
Has Oil Replaced “Dr. Copper” As “The” Indicator?
“Davidson” submits:
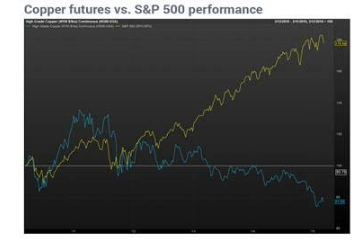
The $WTI and US$ have been in an inverse relationship since 2001. In my experience this was due to Momentum Investor algorithms which were following the ‘Dr. Copper’ concept that traders had deployed for years. Namely, copper price trends were used in a simplistic ‘quick&dirty’ method of tracking economic activity and predicting stock markets. This changed in the current economy with copper prices falling in the face of continued economic expansion and rising equity markets.
http://www.marketwatch.com/story/how-copper-lost-its-role-as-a-leading-indicator-2015-03-12
The metal went ‘from Ph.D to deadbeat’
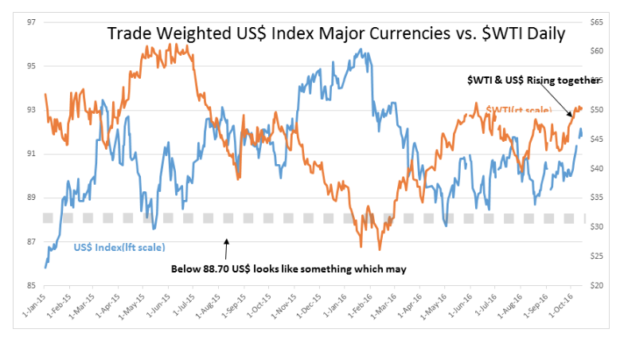
Oil in similar fashion became tied to economic activity and recessions roughly beginning in 2001. As recently as February 2016, Momentum Investors were fearful of an imminent financial collapse when $WTI dropped well below $30 BBL on US$ strength-see Trade Weighted US$ Index Major Currencies vs. $WTI Daily. Lately, a divergence has emerged.
Since early Oct 2016, $WTI and US$ have both been rising. Certainly not only has the recession forecasted Feb 2016 not transpired, but economic activity has continued unabated in the face of high levels of pessimism. The US just reported record oil consumption with record number of vehicle miles. China continues to set record consumption and importation in an uninterrupted up-trend the past 4yrs.
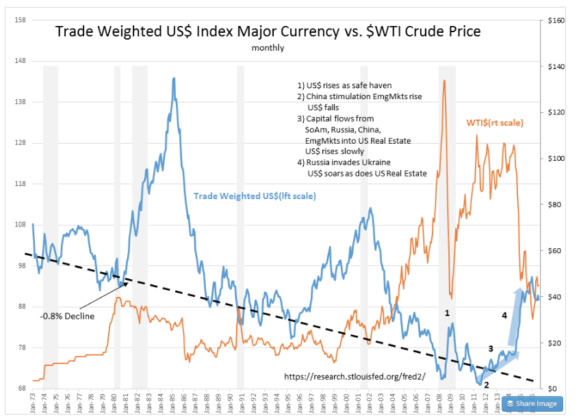
Oil prices appear to be losing the ‘quick&dirty’ analysis ‘Dr. Copper’ as economic activity continues its expansion. Oil prices which have a long history to being inversely related to the US$-see Trade Weighted US$ Index Major Currency vs. $WTI Crude Price monthly, may also be showing some independence from the US$.
There are multiple global trends at the moment which explain this divergence. The US$ strength 2014-2016 can be tied to US withdrawal as a global supporter of Democracy which has caused capital to pool in Western countries, especially real estate, where protections for property rights remain intact. While this has resulted in currency shifts which have impacted global trade somewhat, global economic activity continues to expand which is accompanied by greater demand for fossil fuels.
We have had many periods when investors performed ‘quick&dirty’ analysis using prices of single data series as a basis. Most recently, falling prices in oil have been interpreted as falling demand or excess supply. Few have made the connection to US$ in which oil has been priced. The evidence, even though incomplete, heavily leans towards investors being too simple in their use of oil prices as an economic indicator.
1) Oil prices, like copper, has been misinterpreted by investors.
2) The global economy is not slowing, but continues to expand.
3) Oil is not in an ‘glut’, because producers continue to produce to meet economic demand.
4) The current divergence in the US$ vs, $WTI may be signaling a change in market psychology that a recession is not imminent.
5) Only time will tell, but we could be on the cusp of market pessimism lifting and finally accepting we are in and have been in a global recovery since 2009.
The information in this blog post represents my own opinions and does not contain a recommendation for any particular security or investment. I or my affiliates may hold positions or other ...
more

