
Hartstreet Oil: FANG's New Permian Acquisition Could Be A Home Run
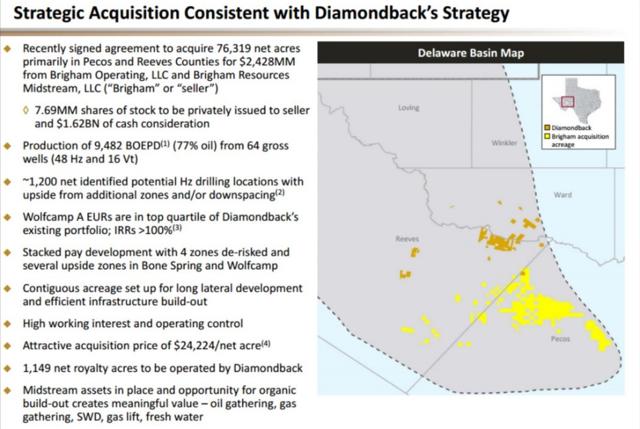
FANG recently spent $2.43 billion on 76,319 net acres in Pecos and Reeves counties. Diamondback added to its 19,000 net acres in the Basin. FANG focused on this county for a couple of reasons. It has the Wolfcamp A, which is a proven economic interval. The Bone Spring and Wolfcamp C have good initial results. The Wolfcamp A has similar economics of the Lower Spraberry in Midland. The map below provides the added acreage.
(Source: Diamondback Energy)
Pecos County hasn't seen as much activity due to depth. Decreased depth usually is associated with decreased well pressures and results. With almost 3,000 feet of payzone, there is upside development and downspacing. This includes the 2nd Bone Spring, 3rd Bone Spring, upper Wolfcamp A, and Wolfcamp B. There is further upside to the 1st Bone Spring, lower Wolfcamp A, and Wolfcamp C/D. Multiple options, means more possibilities.
(Source: Welldatabase.com)
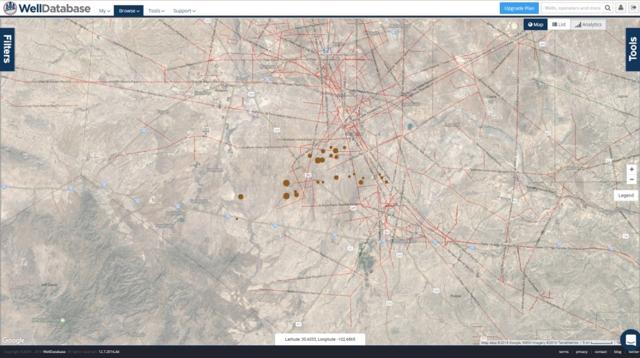
The wells acquired from Brigham are shown on the welldatabase.com map above. The bigger the well spot, the more oil produced. Keep in mind it does not factor producing days. More oil could just mean it has produced longer, and doesn't mean the well is better. The Wolfcamp A has seen the greatest traffic. It is the best payzone in this area. The Wolfcamp B, 2nd Bone Spring, and 3rd Bone Spring have also been tested. Some thought Pecos wouldn't be productive, but it looks good so far.
(Source: Diamondback Energy)
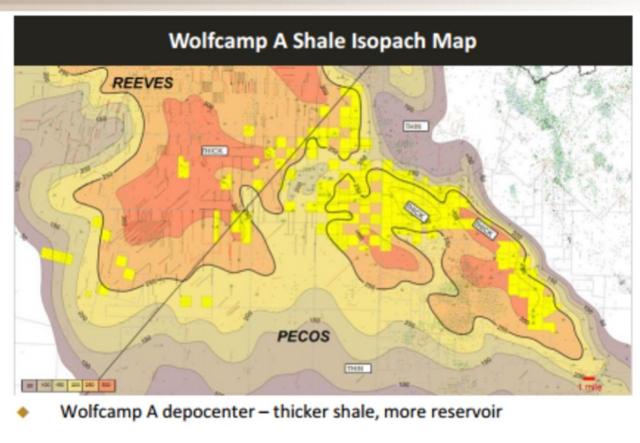
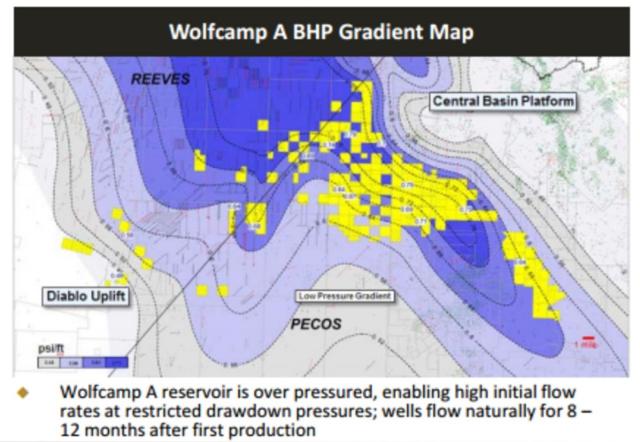
FANG's new acreage is in a Wolfcamp A sweet spot. This area is over-pressured and thick.
(Source: Diamondback Energy)
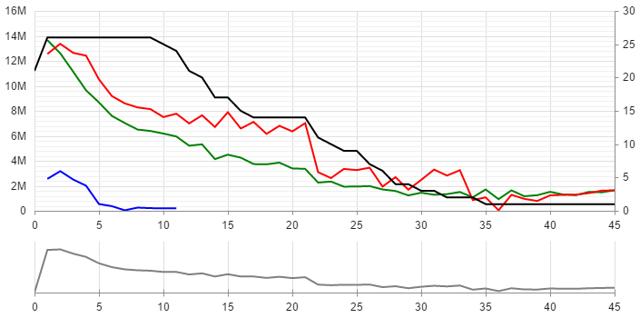
There are 26 horizontal wells were in Pecos and Reeves counties, used in this analysis. There are many operators with current locations in Pecos, Ward, and Reeves counties. Whiting Petroleum Corp. (NYSE:WLL), Kinder Morgan (NYSE:KMI), Apache Corp. (NYSE:APA), Chevron Corp. (NYSE:CVX), Energen Corp. (NYSE:EGN), Cimarex Energy Co. (NYSE:XEC), and Anadarko Petroleum Corp. (NYSE:APC) are just a few. Brigham's first well was turned to sales 45 months ago. Its tenth well was completed 23 months ago. Brigham's 26 wells have provided a flat decline curve, like most Permian horizontal wells.
(Source: Welldatabase.com)
The oil curve (green) completely flattens at around 30 months. Decline rates are lower than plays like the Bakken and Eagle Ford. Natural gas is red. The number of wells are in black and water is blue. The grey line represents production on a BOE basis.
|
Month |
Oil |
Gas |
MBOE |
Wells |
|
1 |
13657 |
12556 |
15.82 |
26 |
|
2 |
12606 |
13366 |
14.91 |
26 |
|
3 |
11136 |
12642 |
13.32 |
26 |
|
4 |
9642 |
12419 |
11.78 |
26 |
|
5 |
8677 |
10522 |
10.49 |
26 |
|
6 |
7596 |
9187 |
9.18 |
26 |
|
7 |
7028 |
8599 |
8.51 |
26 |
|
8 |
6500 |
8276 |
7.93 |
26 |
|
9 |
6387 |
8135 |
7.79 |
26 |
|
10 |
6183 |
7501 |
7.48 |
25 |
|
11 |
5950 |
7772 |
7.29 |
24 |
|
12 |
5210 |
6992 |
6.42 |
21 |
|
13 |
5319 |
7645 |
6.64 |
20 |
|
14 |
4137 |
6708 |
5.29 |
17 |
|
15 |
4492 |
7890 |
5.85 |
17 |
|
16 |
4252 |
6591 |
5.39 |
15 |
|
17 |
3738 |
7113 |
4.96 |
14 |
|
18 |
3722 |
6156 |
4.78 |
14 |
|
19 |
3854 |
6802 |
5.03 |
14 |
|
20 |
3392 |
6353 |
4.49 |
14 |
|
21 |
3354 |
7014 |
4.56 |
14 |
|
22 |
2259 |
3092 |
2.79 |
11 |
|
23 |
2339 |
2618 |
2.79 |
10 |
|
24 |
1934 |
3350 |
2.51 |
9 |
|
25 |
1941 |
3259 |
2.50 |
9 |
|
26 |
1976 |
3449 |
2.57 |
7 |
|
27 |
1707 |
1940 |
2.04 |
6 |
|
28 |
1587 |
2691 |
2.05 |
4 |
|
29 |
1232 |
1689 |
1.52 |
4 |
|
30 |
1448 |
2475 |
1.87 |
3 |
|
31 |
1283 |
3297 |
1.85 |
3 |
|
32 |
1333 |
2819 |
1.82 |
2 |
|
33 |
1502 |
3247 |
2.06 |
2 |
|
34 |
1084 |
859 |
1.23 |
2 |
|
35 |
1705 |
1072 |
1.89 |
1 |
|
36 |
932 |
37 |
0.94 |
1 |
|
37 |
1634 |
1277 |
1.85 |
1 |
|
38 |
1166 |
956 |
1.33 |
1 |
|
39 |
1247 |
785 |
1.38 |
1 |
|
40 |
1517 |
1234 |
1.73 |
1 |
|
41 |
1304 |
1279 |
1.52 |
1 |
|
42 |
1252 |
1292 |
1.47 |
1 |
|
43 |
1510 |
1414 |
1.75 |
1 |
|
44 |
1479 |
1613 |
1.76 |
1 |
|
45 |
1639 |
1638 |
1.92 |
1 |
|
Totals |
173,841 |
227,621 |
213.05 |
(Source: Welldatabase.com)
Brigham's averaged 173,000 BO in the first 45 months. After 12 months, the averaged over 100,000 BO. Production improvements continue to be seen, especially when we focus on those turned to sales from 11/14 to present. The 19 horizontals' type curve is shown below.
|
Month |
Oil |
Gas |
BOE |
Wells |
|
1 |
15984 |
14899 |
18.55 |
19 |
|
2 |
14880 |
16166 |
17.67 |
19 |
|
3 |
12998 |
14961 |
15.58 |
19 |
|
4 |
11364 |
14999 |
13.95 |
19 |
|
5 |
10118 |
12445 |
12.26 |
19 |
|
6 |
9080 |
11055 |
10.99 |
19 |
|
7 |
8513 |
10563 |
10.33 |
19 |
|
8 |
7627 |
10054 |
9.36 |
19 |
|
9 |
7563 |
9795 |
9.25 |
19 |
|
10 |
7513 |
9188 |
9.1 |
18 |
|
11 |
7501 |
9406 |
9.12 |
17 |
|
12 |
6739 |
9023 |
8.3 |
14 |
|
13 |
6809 |
9862 |
8.51 |
13 |
|
14 |
5591 |
9958 |
7.31 |
10 |
|
15 |
6254 |
11363 |
8.21 |
10 |
|
16 |
6055 |
10505 |
7.87 |
8 |
|
17 |
5567 |
13102 |
7.83 |
7 |
|
18 |
5451 |
11435 |
7.42 |
7 |
|
19 |
5801 |
12034 |
7.88 |
7 |
|
20 |
5034 |
11657 |
7.04 |
7 |
|
21 |
4829 |
11347 |
6.79 |
7 |
|
22 |
3735 |
4761 |
4.56 |
4 |
|
23 |
4255 |
5375 |
5.18 |
3 |
|
24 |
3567 |
8339 |
5 |
2 |
|
25 |
3552 |
7768 |
4.89 |
2 |
|
26 |
2281 |
9231 |
3.87 |
1 |
|
Total |
188659 |
279290 |
236.82 |
(Source: Welldatabase.com)
The 12-month oil production data from all Brigham wells was 100,572 BO. Those brought online after 11/14 improved to 119,880 BO. Production improves again in wells starting in August of 2015. There were nine wells over this time frame.
|
Month |
Oil |
Gas |
MBOE |
Wells |
|
1 |
17219 |
16313 |
20.03 |
9 |
|
2 |
16900 |
16602 |
19.76 |
9 |
|
3 |
14706 |
14745 |
17.25 |
9 |
|
4 |
12728 |
12877 |
14.95 |
9 |
|
5 |
10949 |
11569 |
12.94 |
9 |
|
6 |
9805 |
9702 |
11.48 |
9 |
|
7 |
9392 |
9234 |
10.98 |
9 |
|
8 |
7698 |
7550 |
9.00 |
9 |
|
9 |
8254 |
7357 |
9.52 |
9 |
|
10 |
8646 |
7762 |
9.98 |
8 |
|
11 |
8325 |
7499 |
9.62 |
7 |
|
12 |
7396 |
6751 |
8.56 |
4 |
|
13 |
8249 |
8143 |
9.65 |
3 |
|
Total |
140266 |
136104 |
163.72 |
(Source: Welldatabase.com)
The first 13 months of production are telling. Production improvements continue.
|
Month |
Oil |
Oil |
Oil |
|
1 |
13657 |
15984 |
17219 |
|
2 |
12606 |
14880 |
16900 |
|
3 |
11136 |
12998 |
14706 |
|
4 |
9642 |
11364 |
12728 |
|
5 |
8677 |
10118 |
10949 |
|
6 |
7596 |
9080 |
9805 |
|
7 |
7028 |
8513 |
9392 |
|
8 |
6500 |
7627 |
7698 |
|
9 |
6387 |
7563 |
8254 |
|
10 |
6183 |
7513 |
8646 |
|
11 |
5950 |
7501 |
8325 |
|
12 |
5210 |
6739 |
7396 |
|
13 |
5319 |
6809 |
8249 |
|
Totals |
105,891 |
126,689 |
140,267 |
(Source: Welldatabase.com)
Over the first 13 months, there is a steady improvement. Production improvements are carried through each and every month. These are not just core wells, we have included all areas and intervals. 20-25% of the wells Brigham drilled were focused outside the Wolfcamp A.
We have figured the well economics of FANG's new Delaware leasehold. We have figured its Midland locations as well. The date of initial production was 11/14 or later. We did not focus on area or interval.
|
FANG Delaware Economics |
||
|
EUR: |
186,092 BO |
|
|
Months: |
23 |
|
|
Selling Price: |
$50/Bbl. |
|
|
Initial Capital Expense: |
6,700,000 |
|
|
Lease Operating Cost: |
1,982,278 |
|
|
Total |
Working Interest |
|
|
Total: |
9,304,607 |
7,443,686 |
|
Recovered: |
9,304,607 |
7,443,686 |
|
Total |
Working Interest |
|
|
Total: |
-8,682,278 |
-8,682,278 |
|
Recovered: |
-8,682,278 |
-8,682,278 |
|
Total |
Working Interest |
|
|
Total: |
622,328 |
-1,238,592 |
|
Recovered: |
622,328 |
-1,238,592 |
|
Natural Gas Revenues: |
962,732 |
962,732 |
|
Net: |
1,585,060 |
-275,860 |
(Source: Welldatabase.com)
After 23 months of production, the average of wells on-line as of 11/1/2014 have a deficit of $275,860. We figured this for $50/bbl crude (differentials not included). We removed cash costs and NRI of 20% to the land owners. Well costs are higher than those in Midland. Well costs will probably decrease and come closer to Midland's on a per foot basis by the end of 2017. Production is better in Pecos, but well costs are higher.
|
FANG Midland Economics |
||
|
EUR: |
146,086 |
|
|
Months: |
21 |
|
|
Selling Price: |
$50/Bbl. |
|
|
Initial Capital Expense: |
5,000,000 |
|
|
Lease Operating Cost: |
1,555,128 |
|
|
Total |
Working Interest |
|
|
Total: |
7,304,315 |
5,843,452 |
|
Recovered: |
7,304,315 |
5,843,452 |
|
Total |
Working Interest |
|
|
Total: |
-6,555,128 |
-6,555,128 |
|
Recovered: |
-6,555,128 |
-6,555,128 |
|
Total |
Working Interest |
|
|
Total: |
749,187 |
-711,676 |
|
Recovered: |
749,187 |
-711,676 |
|
Natural Gas Revenues: |
543,000 |
543,000 |
|
Net: |
1,292,187 |
-168,676 |
(Source: Welldatabase.com)
Although the economics look better in Midland, production was better in Pecos. Improvements to well design and the addition of infrastructure could turn these economies around. We think Pecos will be a better play in the long run, and additional testing of payzones could make this purchase a home run. There is significant interest in the areas, and still a large number of private operators willing to sell. Recent operators to add acreage are EOG Resources (NYSE:EOG), QEP Resources (NYSE:QEP), SM Energy (NYSE:SM), Parsley Energy (NYSE:PE), Contango Oil & Gas Co. (NYSEMKT:MCF), Resolute Energy Corp. (NYSE:REN), Callon Petroleum Co. (NYSE:CPE), Centennial Resource Development (NASDAQ:CDEV), Matador Resources (NYSE:MTDR), Concho Resources (NYSE:CXO), RSP Permian (NYSE:RSPP), Occidental Petroleum Corp. (NYSE:OXY), and PDC Energy (NASDAQ:PDCE). The implications of lower breakevens could put downward resistance on oil prices and the US Oil ETF (USO). Given the number of acquisitions to come, other ways to play this are through the Energy Select Sector SPDR ETF (XLE) and SPDR S&P Oil & Gas Exploration & Production ETF (XOP). Both have significant exposure to operators looking to add acreage.
Data for the above article is provided by welldatabase.com. This article is limited to the dissemination of general information pertaining to its advisory services, together with access to additional ...
more

