
Gold’s Weekend Reversal – Really So Bullish?
Last week ended with a specific twist – the USD Index took a dive, while the Japanese yen, gold, silver, and mining stocks all moved visibly higher. The reversal right before the end of the week appears to be a very bullish phenomenon for the PMs, but is it really one?
We doubt it, and if it is, then the rally is likely almost over. In other words, it doesn’t seem to be anything that one should be concerned with if they are positioned to take advantage of the big decline in gold. In today’s free analysis, we’ll discuss the situation in the Japanese yen and in gold as the former is currently the most interesting (from PM investors’ point of view) part of the USD Index. (charts courtesy of http://stockcharts.com).
Yen’s Verification
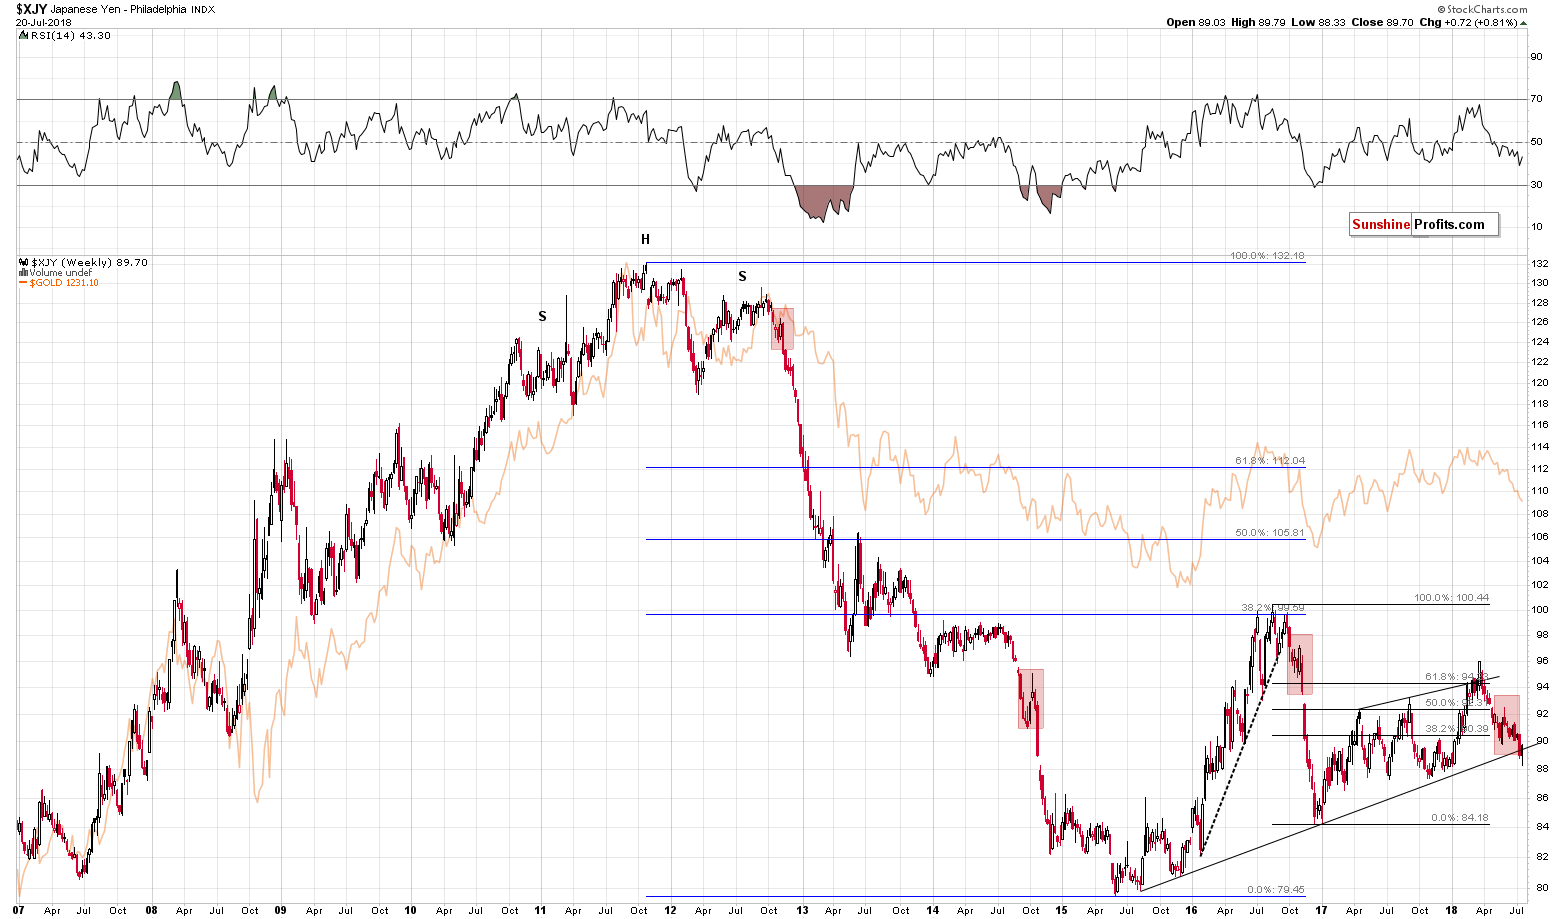
The Japanese yen (USD/JPY) has recently broken below a key long-term support line and its now verifying this breakdown. Consequently, on Friday, we wrote that the currency could move higher in the very short term, but the rising long-term support/resistance line marked the likely end of the decline.
Why has an invalidation been unlikely? Because of the similarity of the preceding action to the three cases from the past few years – they were all followed by sharp declines without meaningful upswings beforehand. We marked them with red rectangles.
When using charts based on the logarithmic scale (as the one above), the mentioned long-term support/resistance line is at about 89.5. This line was slightly broken on Friday, which, seems very important at the first sight.
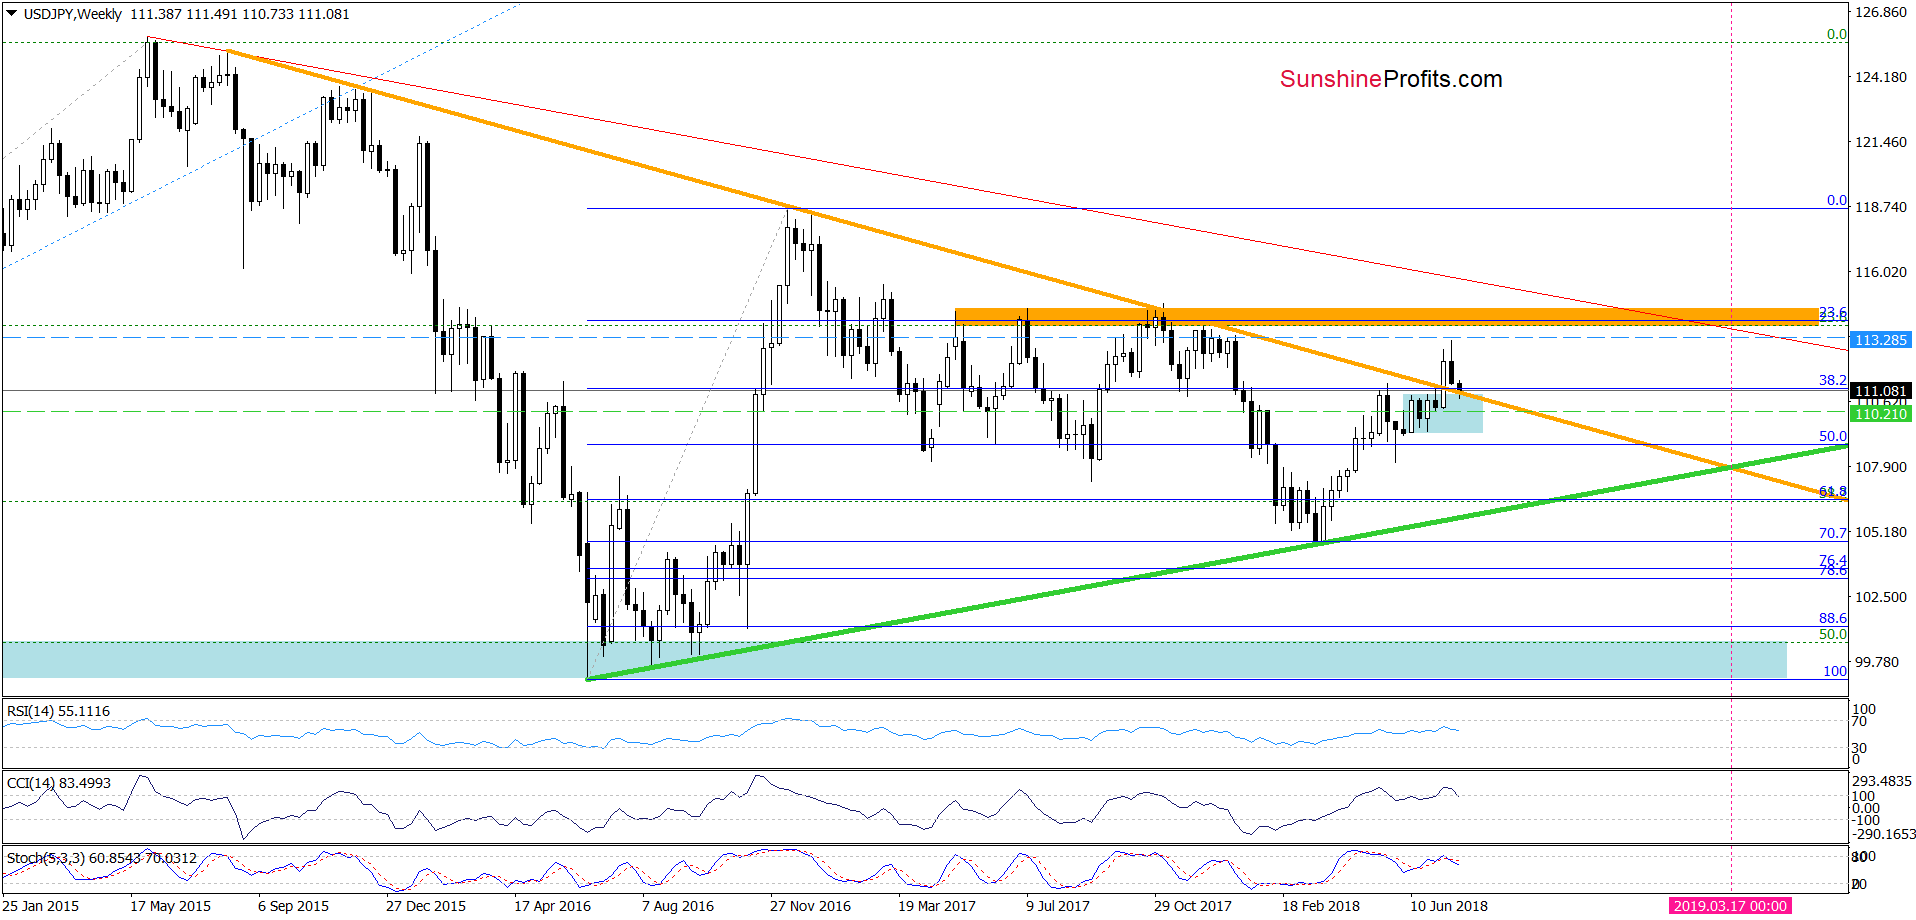
But, when using the linear scale, this line (marked with orange) was not even reached on Friday, let alone broken.
To be precise: the line on the logarithmic chart was insignificantly broken, while the one based on the linear scale was not touched on Friday and we saw a small move below it today (the most recent candlestick on the above chart is this week), which was invalidated. Therefore, it doesn’t seem that the outlook changed. Conversely, it seems that one of the most common post-breakdown patterns took place and since there was no clear invalidation, the outlook remains bearish. Moreover, it seems that the rally in the Japanese yen is over or very close to being over.
By the way, the above chart is inverted, because it features the same currency exchange rate from the other perspective (JPY/SD, while the previous chart featured USD/JPY). We are generally using USD/JPY in the Gold & Silver Trading Alerts, because it’s easier to compare the currency’s price with the one of gold if they move in the same direction; and we are using the USD/JPY pair in our Forex Trading Alerts as that’s how this currency exchange rate is usually traded on its own.
All in all, the above means that the medium-term implications for the precious metals market are as bearish as they were previously, but the short-term implications are more bearish than they were before.
Keeping the above in mind, let’s take a look at Friday’s action in gold.
Gold’s Clear Reversal and Surprising Implications
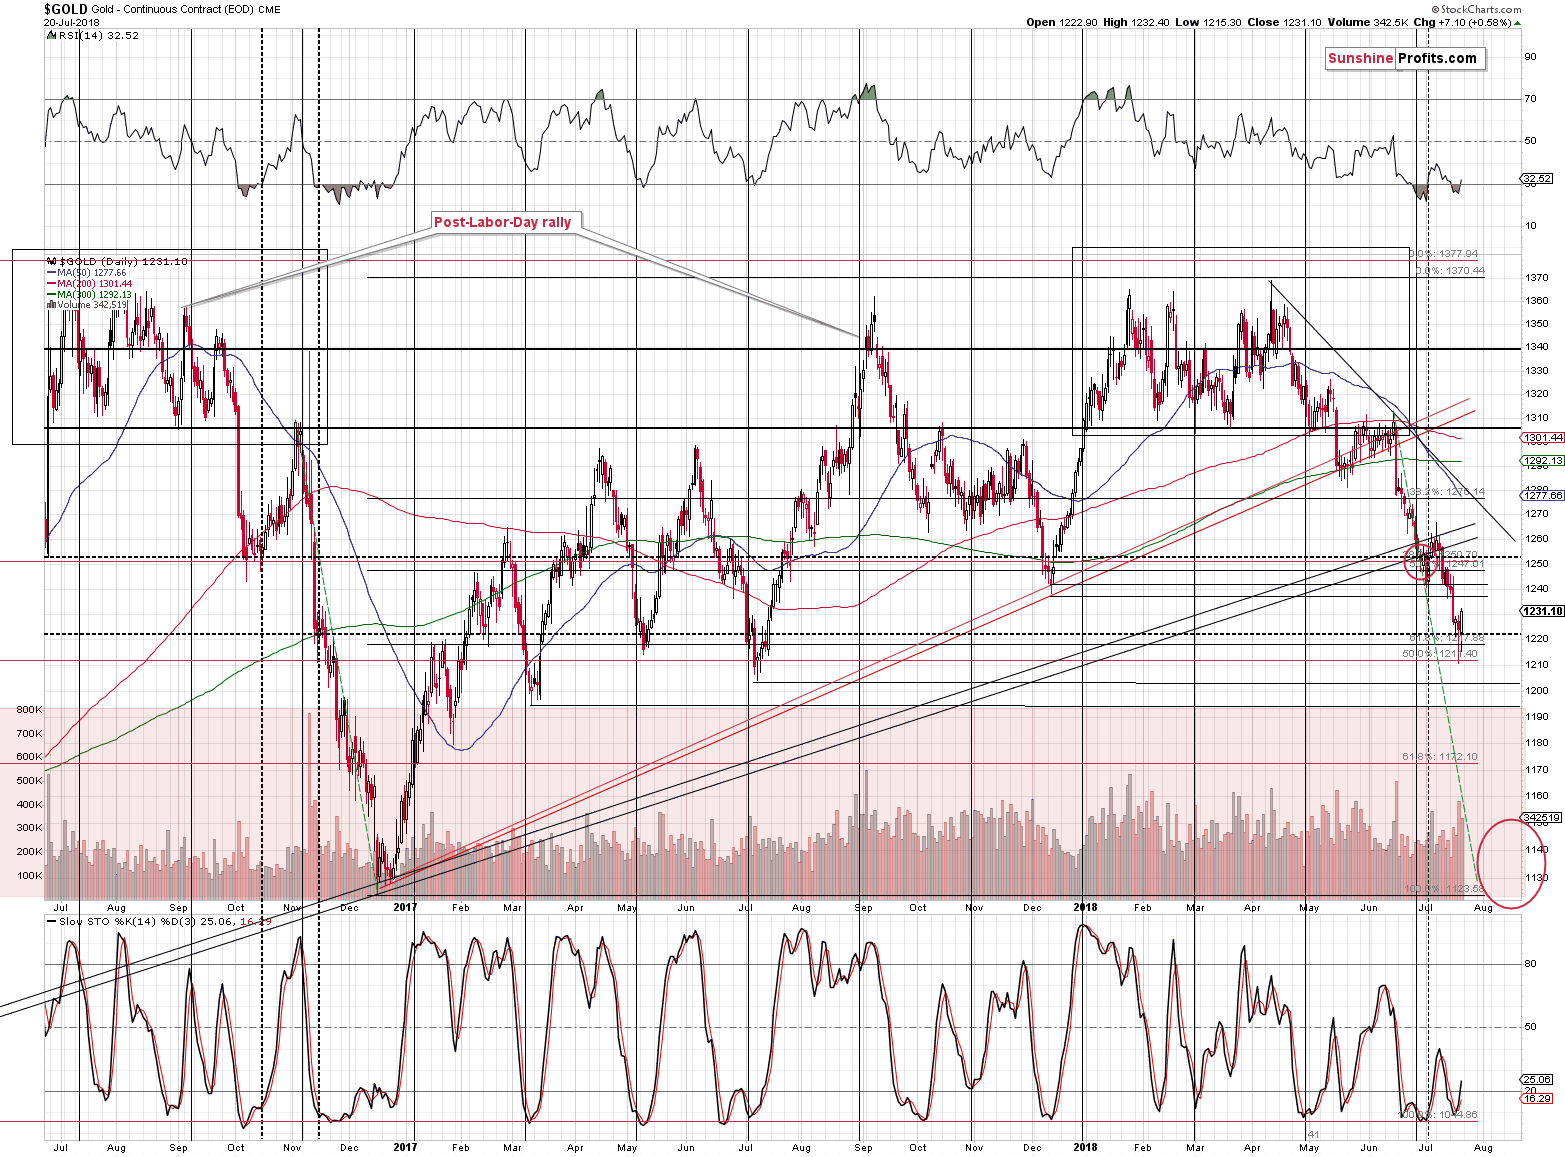
Last week, gold reversed on significant volume after moving temporarily to two Fibonacci retracements and the May and July 2017 lows. That’s a classic buy signal.
Let’s assume, for a minute, that we’re going to get a rally from here. How high would it be likely to take gold? Before Friday’s session, we thought that if the yen repeated its rally and then moved some more (to the above-mentioned long-term support/resistance line), then perhaps we might see something similar in gold.
Given the nearby resistance levels, this meant that gold could have simply moved back to the early July 2018 bottom or the December 2017 bottom – to about $1,240. A bit more above this level if we focus on the analogy to the yen, and a bit less if we consider the fact that during the previous (early July) corrective upswing the initial rally (which took place on July 3rd) was actually most of the entire corrective upswing in gold.
Would a $15 upswing really be worth taking the risk of missing out on profits from a huge slide in prices (below $1,200, perhaps even to $1,130)? No. That’s why we decided to stick to the short position despite the classic buy signal. That was a technical blasphemy, but taking the bigger picture into account, it seemed to be a justified one.
The yen moved to its very short-term target and gold wasn’t even able to use this bullish factor and rally in a similar way. Gold managed to move mere $7 higher, less than half of what it could have easily gained given the action in the Japanese yen. If this was a turning point for gold and a beginning of a major rally, gold should have rallied strongly, and miners should have soared. Nothing like that happened. Conversely, gold rallied insignificantly, while miners’ performance was disappointing.
There’s more to the above chart than just that. The factor that’s been in place for many weeks (remaining below most investors’ radars) is the similarity to what happened on the second half of 2016. The similarity begins with the areas that we marked with black rectangles – several tops that are followed by the initial breakdown and a move back to the previous lows. There is also a correction from about $1,250 in both cases. In the 2016 rally it was the same move that started from $1,250 and took gold back to the previous lows and in the most recent decline, these were separate corrections.
The remarkable similarity is that both rallies from $1,250 started when the RSI first moved below 30. Gold corrected in both cases, and in both cases, it was not the end of decline. Once gold moved below the initial (October 2016, early July 2018) bottom it continued lower to about $1,220 and then moved a bit higher. In both cases RSI moved a bit higher and stayed close to the 30 level. Many investors thought that RSI close to 30 is a buy signal back then and many people are incorrectly (it’s not the case during medium-term downtrends) assuming that now.
Since the self-similar pattern in gold has been in place for so long, one can expect it to continue at least in the near term. What does it tell us? That one should prepare for numerous fake reversals in gold that will be followed by declines. That’s exactly what we saw in November and December 2016 until gold’s slide below $1,130. If the pace of decline is similar this time, we might see gold at this level in a month or so. But, if the USD Index soars as the Japanese yen slides (which seems quite likely), gold may slide in a more decisive manner. We realize that many traders are waiting for more bullish gold trading suggestions, but at this time, we can’t ethically provide such. The charts simply point to lower, not higher prices.
Summary
Summing up, the outlook for the precious metals is extremely bearish for the following weeks and months, and while a short-term corrective upswing was possible, there are signs suggesting that the small corrective upswing is already over.
Disclaimer: All essays, research, and information found on the Website represent the analyses and opinions of Mr. Radomski and Sunshine Profits' associates only. As such, it may prove wrong ...
more

