
Gold's Upside Target Reached - What's Next?
How high can gold rally? To $1,270 - $1,290. That’s what we wrote on December 14. Stockcharts’ intraday high for yesterday’s session is $1,271.40, which means that our target area has already been reached. However, gold will remain in the target area even if the rally continues for another $20 or so. Which scenario is likely to play out and when is it likely to play out? Gold's chart provides answers, so let’s start today’s analysis by taking a closer look at it (charts courtesy of http://stockcharts.com).
(Click on image to enlarge)
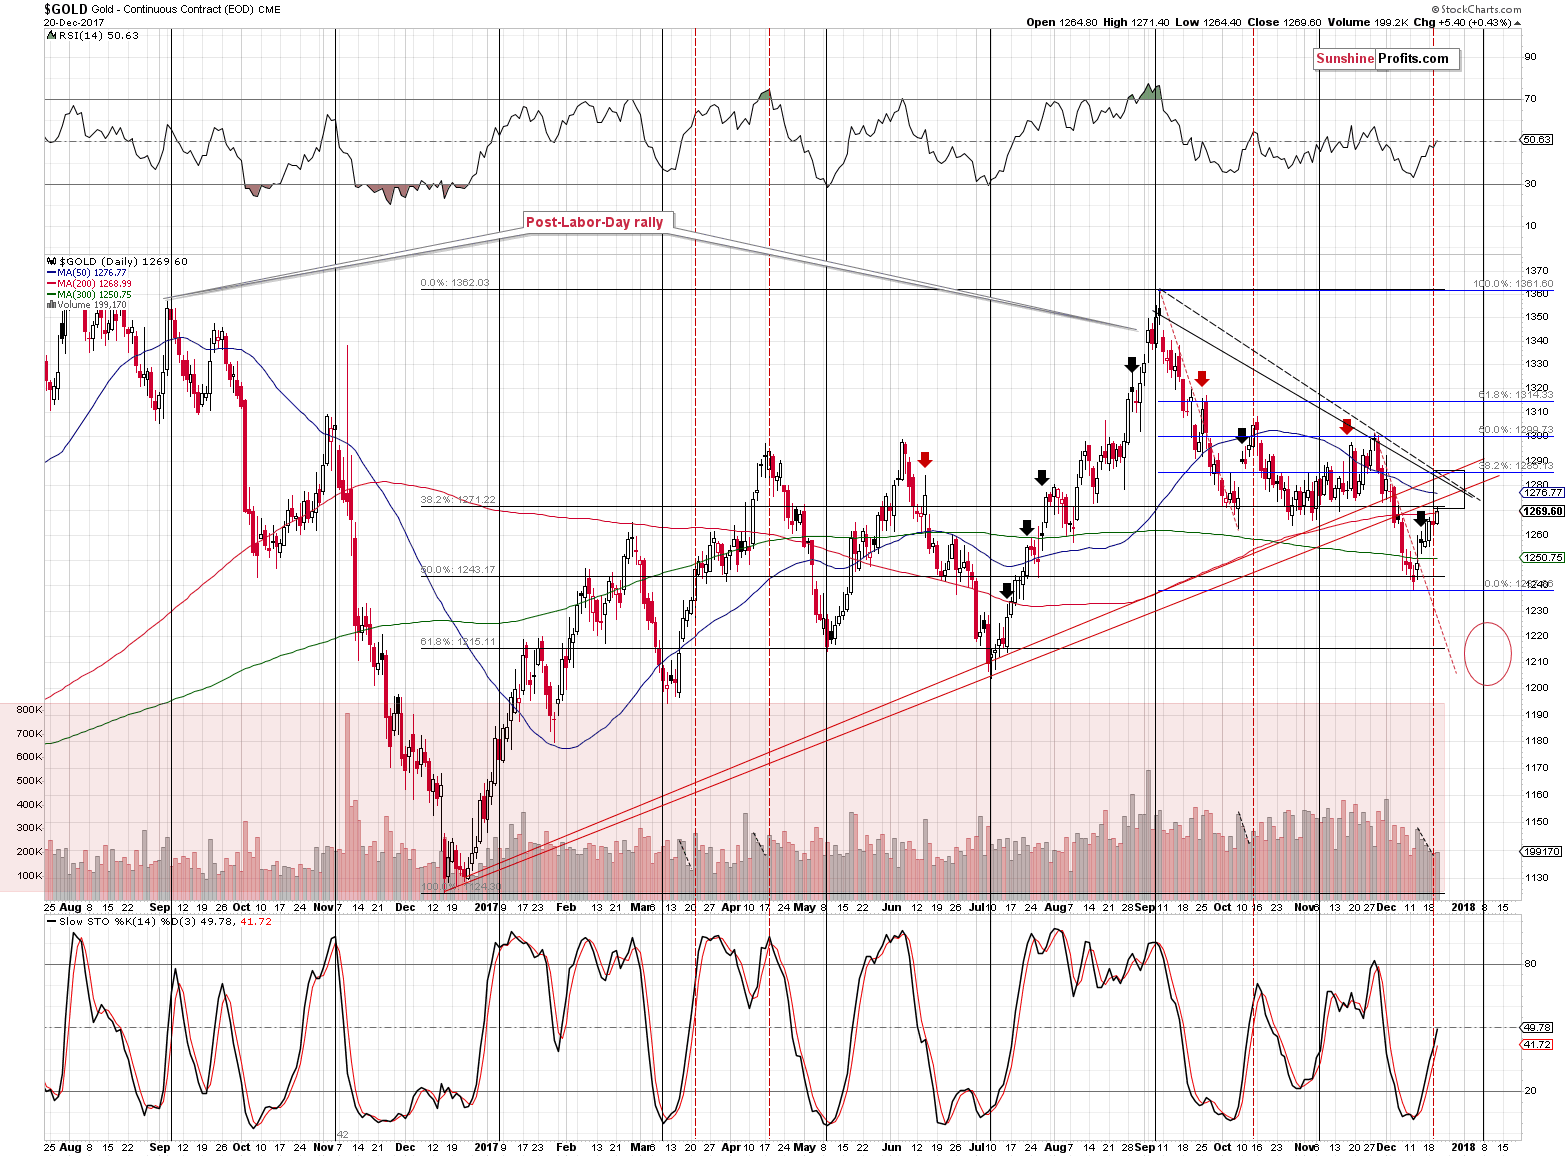
The price of gold has been moving steadily higher in the past several days and it moved to the lower border of our target area.
So, is the rally ending?
Ending – perhaps. Ended – most likely no.
The upper part of the target area is where most resistance levels coincide and since we haven’t seen any meaningful bearish confirmations, gold is likely to move higher in the short term. These resistance levels are:
- The rising red resistance line based on the previous major lows in terms of the daily closing prices
- The declining black resistance line based on the September and November tops in terms of both: intraday and closing prices
- The 38.2% Fibonacci retracement based on the September – December decline
Moreover, the upper part of the target area (above $1,280) is slightly above the 50-day moving average and in the previous two months gold reversed and started to decline only after it moved a bit above this MA.
There is an additional thing that the above chart tells us.
It answers the “when” question.
There are two turning points that are about to be in play. The first one is today or tomorrow and it’s based on the apex of the triangle created by the two lines that we discussed in the bullet points. OK, what was the apex technique again? We first described the apex technique on October 17 when we discussed the following HUI Index chart:
(Click on image to enlarge)
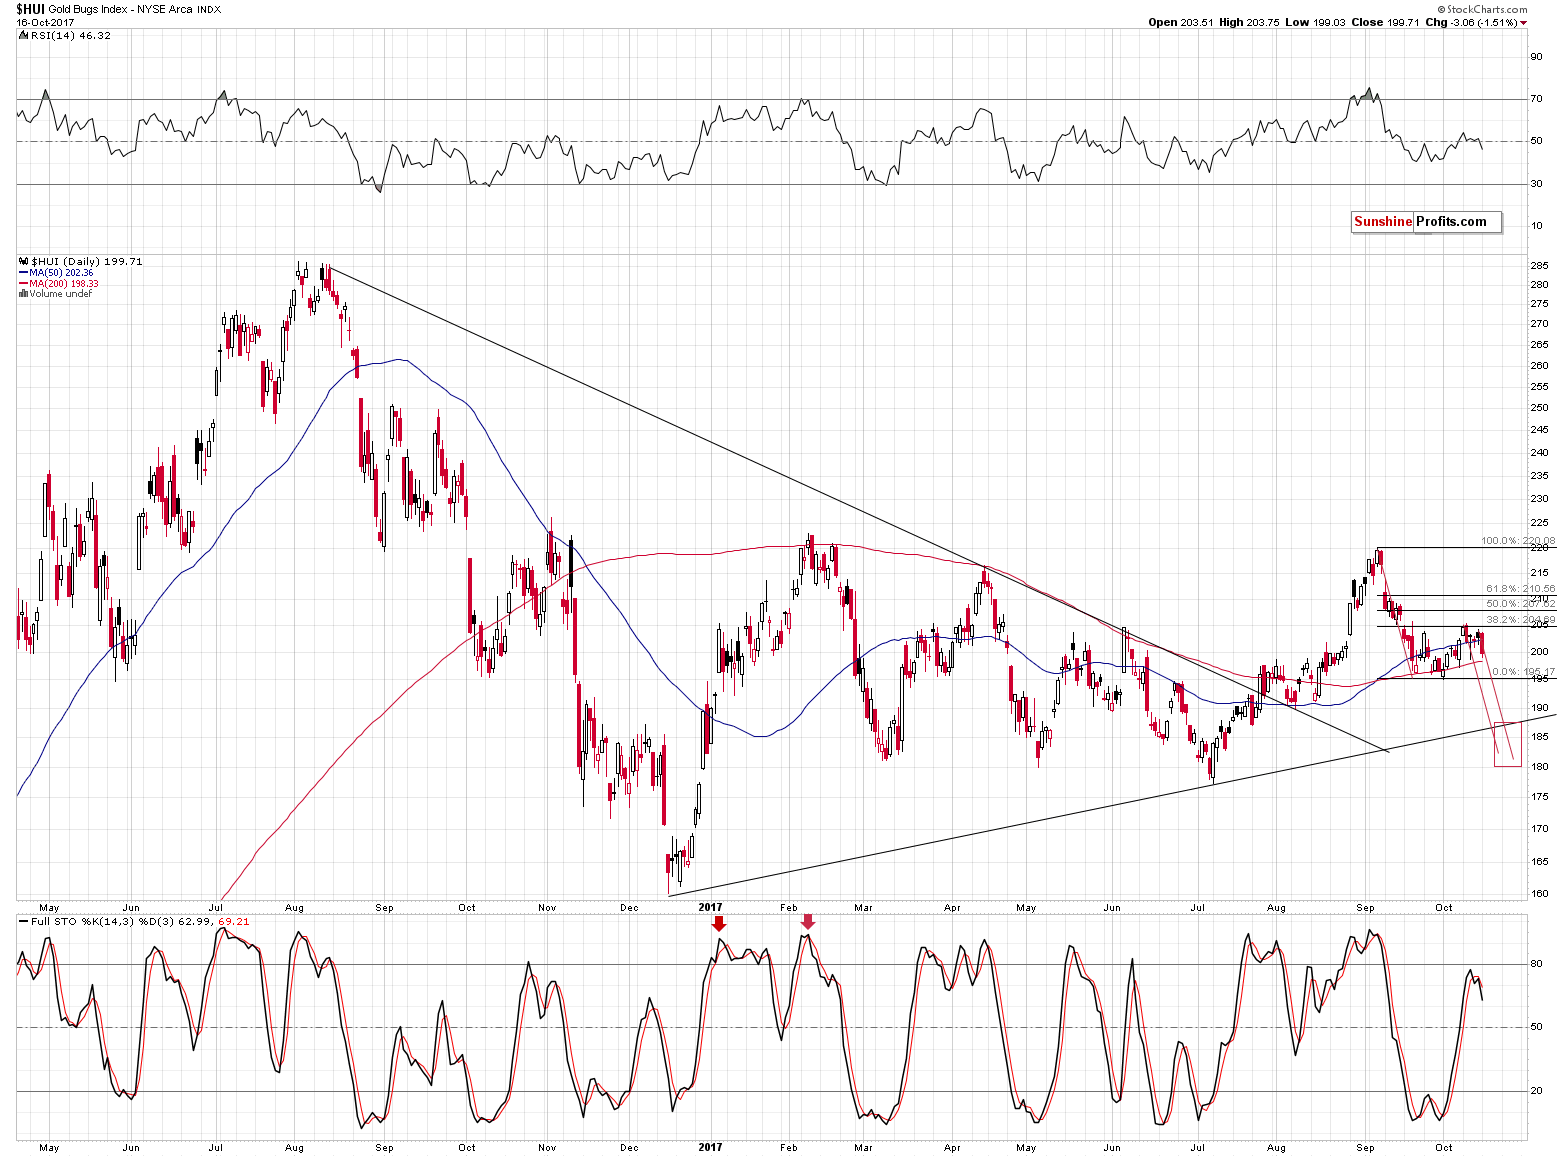
Let’s move back to the HUI Index chart once again as it features a new technique that we’ve been validating for the precious metals market and it finally seems that it’s justified to include it in our set of tools. The technique is the triangle apex reversal. The technique is quite straightforward and even though it may appear somewhat random (it mixes both price and time), it works surprisingly well.
Moving to the point, the triangles are usually drawn in order to create support and resistance levels, check whether a breakout or breakdown is more likely and estimate the likely size of the move that follows the breakout or breakdown. However, if one continues to draw the triangle borders until they cross, they will get a quite precise time target. You can see the above in action on the HUI Index chart. The triangle’s apex is a bit below 185, in early September. The former is irrelevant, but the time wasn’t. The HUI Index indeed topped in early September.
We noticed that the more visible the triangle is and the greater number of extremes confirm its existence, the more reliable the prediction for the turning point becomes.
The apex of the triangle in gold is either today or tomorrow. Naturally, the turnaround is not imminent, but the above is enough for one to be on the lookout for bearish confirmations and be prepared to take profits by closing one’s long position shortly.
The second turning point is based directly on gold’s cyclical nature. It’s on January 8th, so it’s still relatively far, however, at the same time it’s something that we should keep in mind. If gold tops shortly as the first triangle’s apex suggests, then it could start a decline and form a temporary bottom close to January 8th.
Alternatively, we could see another wave up and the final top close to January 8th. Could the counter-trend upswing really last that long?
Yes, and we need to keep both possibilities in mind while monitoring the market for bullish and bearish confirmations. For now, we have increasing an number of bullish signs for the short term.
(Click on image to enlarge)
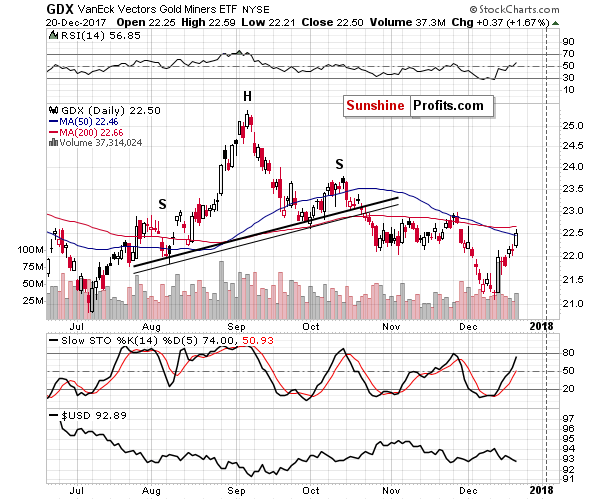
Mining stocks rallied outperforming gold, which is a classic bullish sign. The sizable volume during yesterday’s upswing adds to the bullish signal’s credibility. If we the top was just around the corner, weakness in the miners should be present and we are seeing something opposite.
Did silver soar as well? Well, it did move higher, but to say that it soared would be an exaggeration. We didn’t see any exceptional strength in it. Without this important bearish confirmation, it seems that the top is not yet in. Will it be in after today’s or tomorrow’s session? Knowing silver’s tendency to ignite big intraday moves, it’s certainly possible. At the same time, it’s possible that the rally will continue for several additional days. The best approach is to wait for the white metal to start its strong outperformance of gold and take action at that time. Naturally, we’ll keep our subscribers informed and send intraday alerts if necessary.
How does the above relate to the forex market?
(Click on image to enlarge)
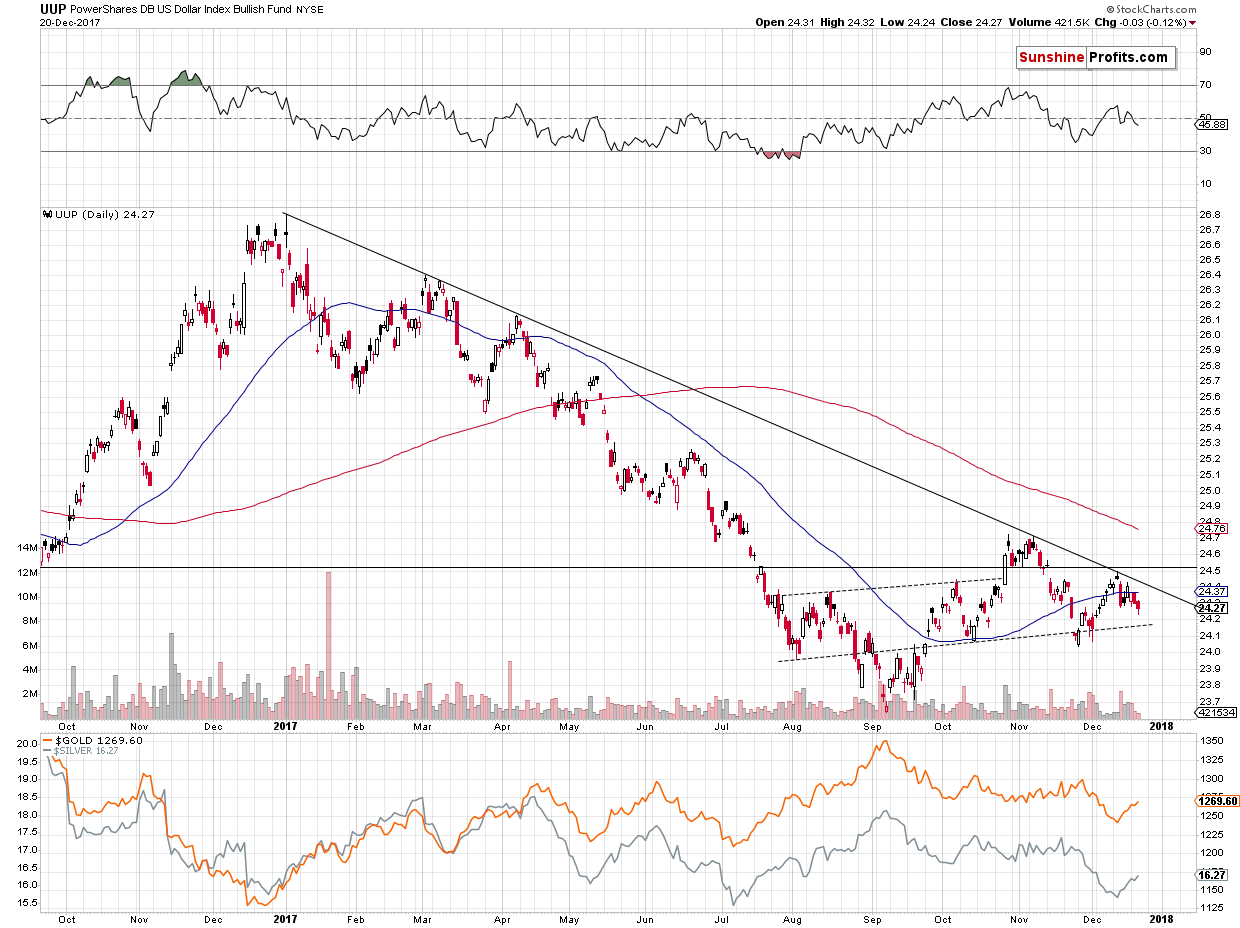
The USD Index (the above chart features the UUP ETF which is a proxy for the USD) could still move lower before turning up again – the October and November lows could be touched, but we think that a confirmed breakdown below them is not likely. The USD’s decline is likely to result in an upswing in the precious metals sector, so the above chart more or less confirms what we wrote earlier today.
The USD is close enough to the previous lows to reach them within just one or two sessions, but at the same time it’s far enough for the decline to these levels to take several days. Based on the way the USD declined in October, the former is more likely.
Summing up, the medium-term outlook for the precious metals market didn’t change based on last and this week’s developments and it remains bearish, but the short-term outlook is bullish. Yesterday’s strength in mining stocks and the lack of it in silver serve as bullish confirmations. Given these additional bullish signs, we have decided to increase our initial target levels for mining stocks and related ETFs in order to increase the profitability of our current long positions in the precious metals sector.
Disclaimer: All essays, research, and information found on the Website represent the analyses and opinions of Mr. Radomski and Sunshine Profits' associates only. As such, it may prove wrong ...
more

