
Golden Tears
(Click on image to enlarge)
Like the rain streaming down a window pane in a heavy storm, so gold continues to fall just as fast and no doubt reflecting the tears of the gold bugs, who must be wondering when and if gold will ever rise again. The last three days have been cruel for them by any standard with the precious metal having shed over $39 per ounce in the period, and perhaps more importantly blasted through the psychological $1200 per ounce level with impunity. For gold traders, these are wonderful trading days and ones where the technical aspects of intraday trading pay handsome dividends whether in the real world futures market of the GC contract or on the less financially demanding derivates offered increasingly by many MT5 brokers.
So the two questions now uppermost, are where next for gold, and when is this bearish trend likely to be reversed? And to do this, we need to consider both the shorter and longer term timeframes. And regular readers of my analysis will already be familiar with my gold outlook where I have been signaling the current bearish trend for some time. You can read one of these here ‘gold bears tearing the metal apart‘
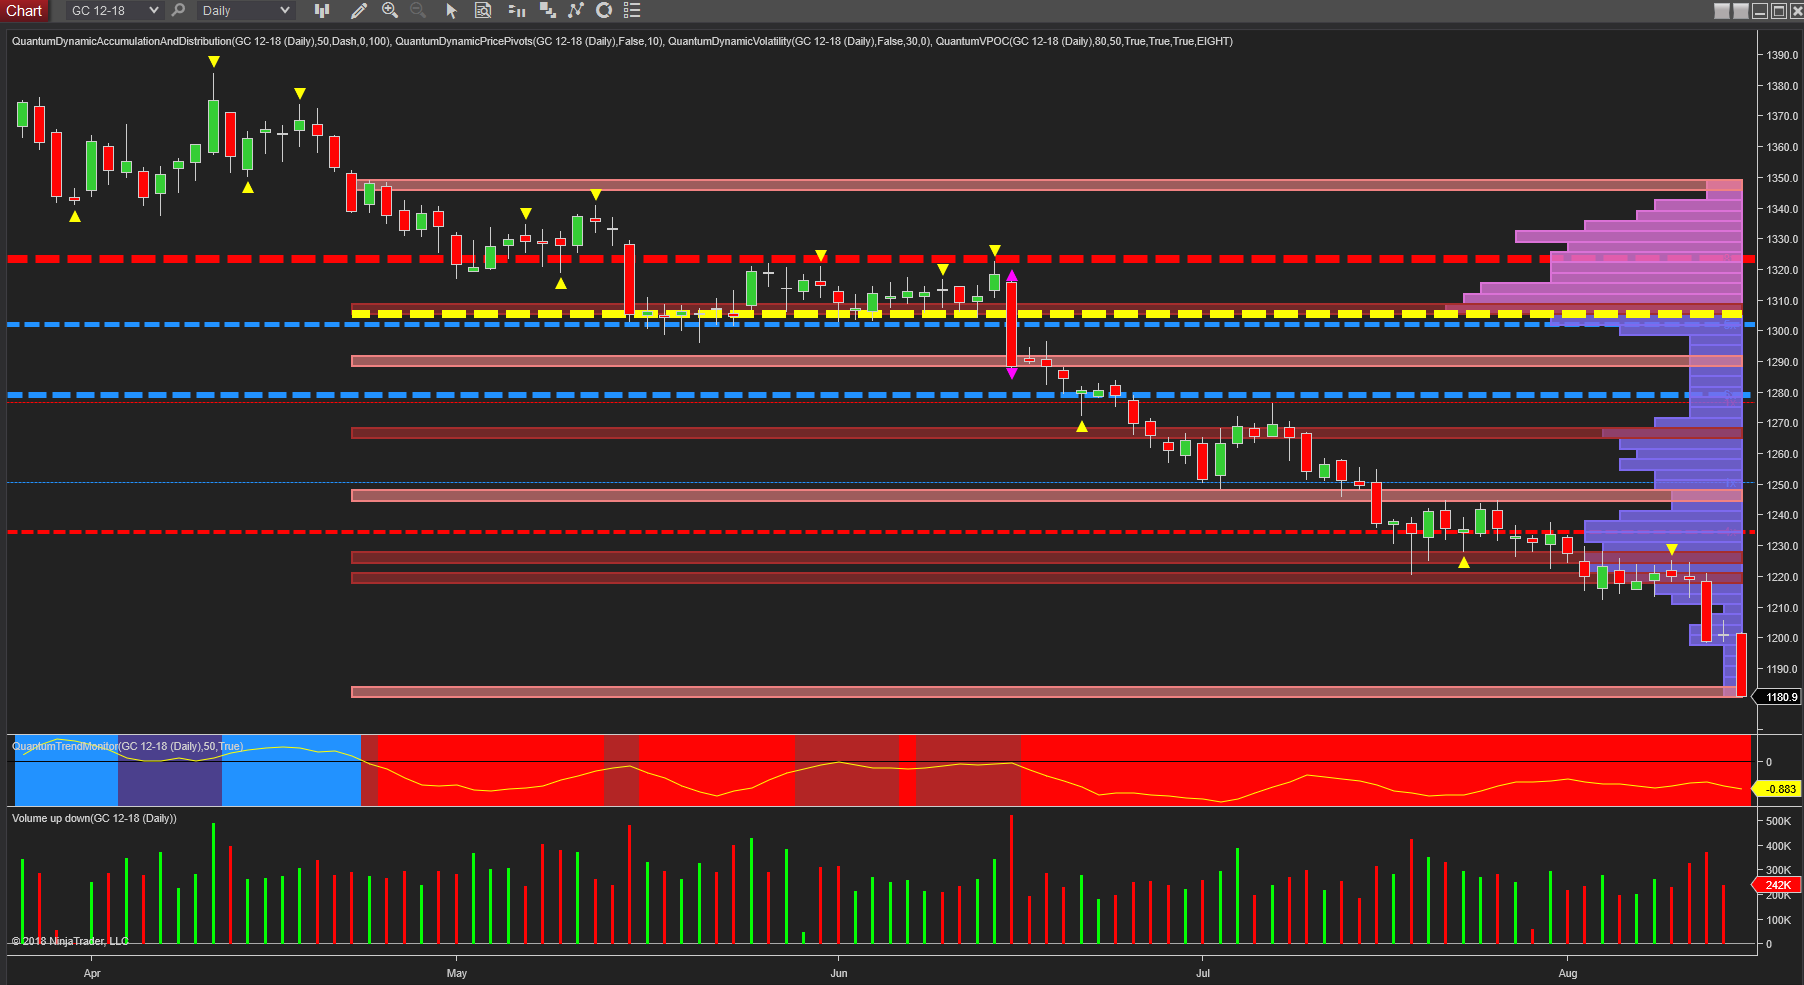
If we start with the daily chart, the volume point of control remains firmly anchored in the $1304 per ounce area adding huge downwards pressure on the metal, and with the various levels of $1325, $1280, $1230 and now $1200 per ounce all having been breached, and with a low volume node now ahead, these are now all combining to pressure the metal lower. Volume and price are in agreement and with the trend monitor indicator remaining bright red, there is nothing here to suggest a major reversal any time soon. Selling volume remains in agreement with the price action, with no suggestions of any buyers of size in the market.
(Click on image to enlarge)
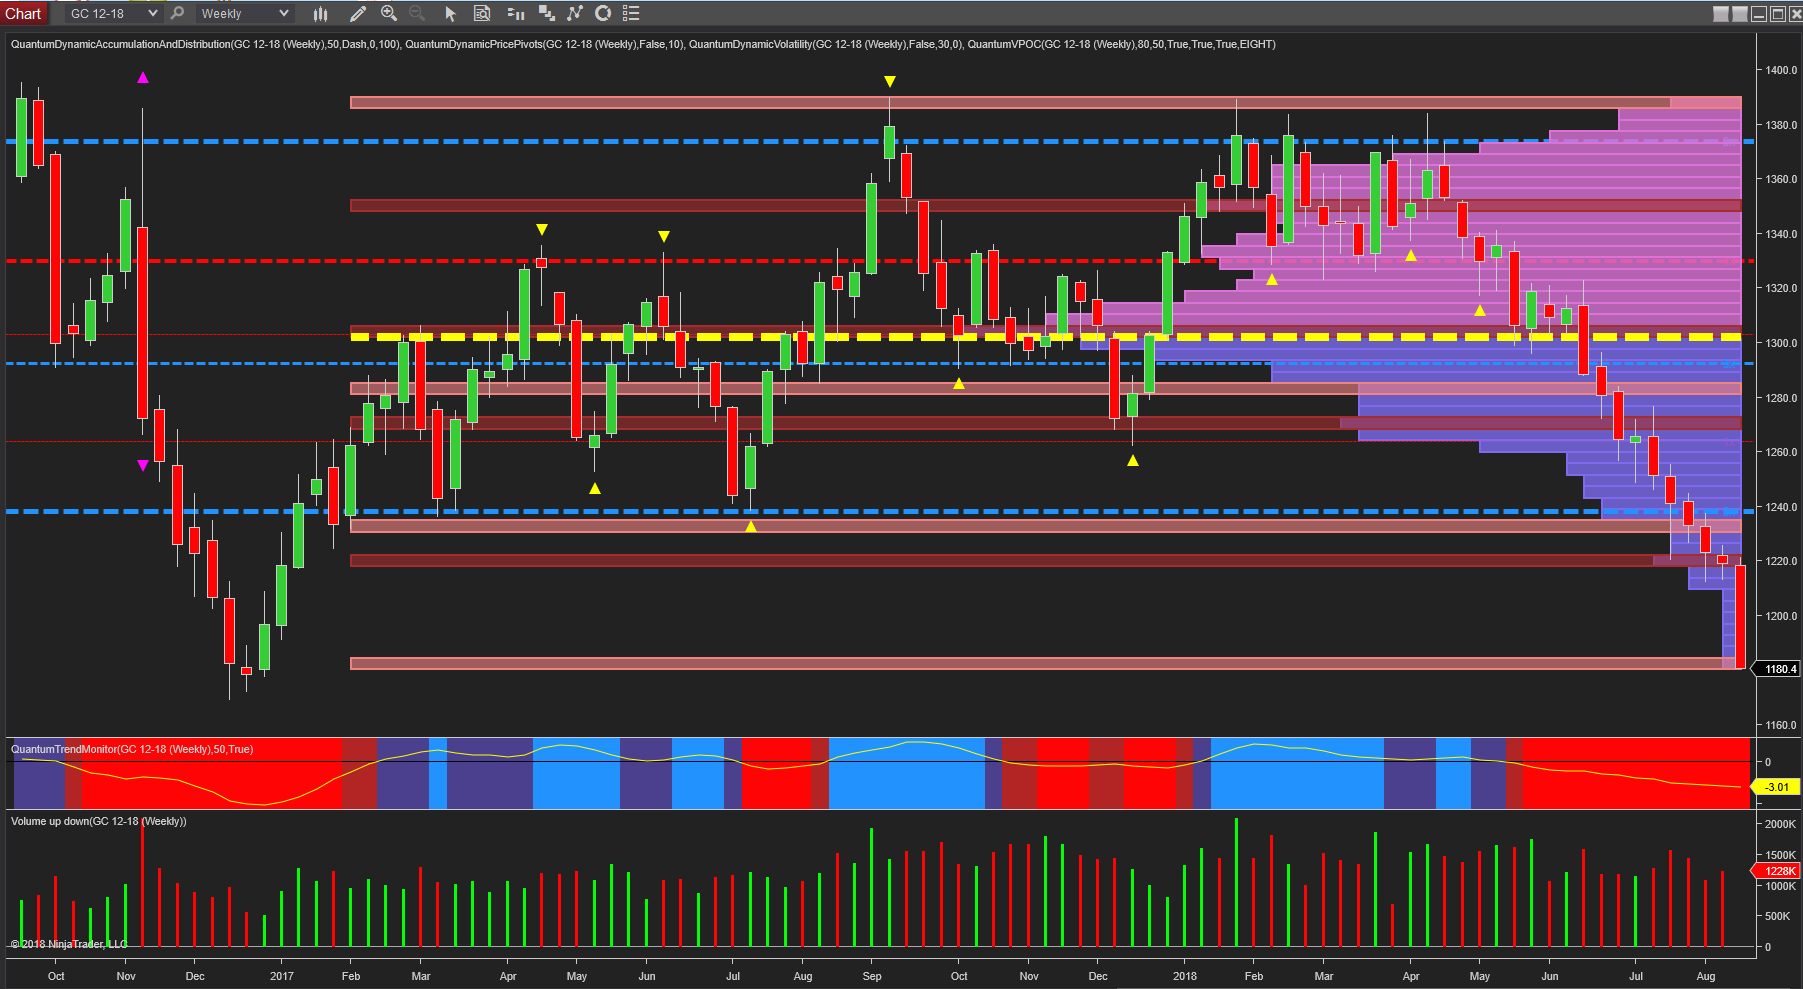
Moving to the weekly chart, this makes more dismal reading for gold bugs, with the precious metal bleeding blood red across the screen, as week after week the metal falls. Here too, the volume point of control is at the same level as for the daily chart, and once again we are approaching a low volume node, which signals a swift move through this level as there is no significant volume to act as a cushion to a deeper move. The trend monitor, here too, has been red since mid-May and the only comfort that can be taken on this chart is the possible support region at $1169 per ounce which was last tested in December 2017.
(Click on image to enlarge)

Finally to the monthly chart where we can see the significance of the $1250 per ounce support platform as denoted by the blue dashed line, and which was duly breached last month, opening the way to the current move lower. With the $1200 per ounce region now also dispatched, the $1106 per ounce low of December 2015 is taking on increasing significance, and as the volume profile on the y-axis of the chart continues to decline, so the speed of fall is likely to increase as a result. This timeframe also describes the immense and overwhelming downwards pressure on the chart with layer up layer of resistance now building, forcing the precious metal lower, and confirmed with sustained selling volume under each down candle. Yes, there will be pause points and minor reversals, but there is nothing to suggest on this chart, or indeed on any other, that the bears are done just yet.
All the charts are from NinjaTrader and for the December gold futures contract.
Disclaimer: Futures, stocks, and spot currency trading have large potential rewards, but also large potential risk. You must be aware of the risks and be willing to accept them in order to invest in ...
more

