
Gold Prices Vulnerable At Key Chart Support On US PMI Data
Gold prices edged lower as a recovery in risk appetite pushed Treasury bond yields higher alongside stock prices. The US Dollar also rose in tandem as improving sentiment echoed in a supportive shift in Fed rate hike expectations. Not surprisingly, this undermined the appeal of non-interest-bearing and anti-fiat assets epitomized by the yellow metal.
August’s US PMI survey roundup is in focus on the data front, with the pace of manufacturing- and service-sector activity growth expected to accelerate. US economic news-flow has increasingly improved relative to forecasts over the past two months, opening the door for outperformance. While that may hurt gold, follow-through will likely have to wait for Fed Chair Yellen’s speech on Friday.
Crude oil prices stalled absent a meaningful catalysts. API said US inventories shed 3.6 million barrels last week. That is within a hair of the 3.3 million barrel drawdown expected to be reported in official EIAstatistics today and so was probably read as status-quo. Chinese energy trade statistics are also due to cross the wires.
GOLD TECHNICAL ANALYSIS – Gold prices remain locked in a range below resistance in the 1295.46-1300.46 area (double top, 38.2% Fibonacci expansion). Negative RSI divergence continues to warn of ebbing upside momentum, which may precede a downturn. Breaking below 1278.22 (23.6% Fib retracement, trend line) on a daily closing basis targets the 38.2% level at 1264.23 next. Alternatively, a breach of resistance exposes the 50% expansion at 1310.74.
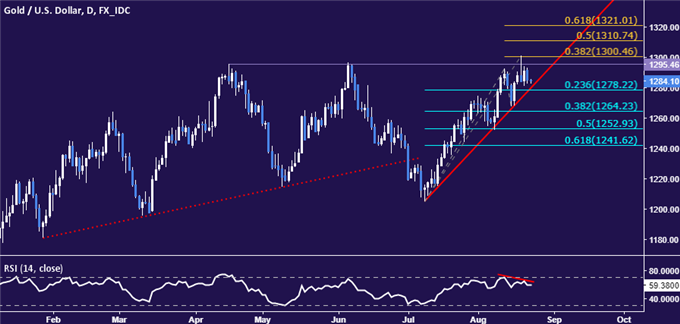
Chart created using TradingView
CRUDE OIL TECHNICAL ANALYSIS – Crude oil prices are stalling having found support above the $46/barrel figure. From here, a daily close below the 38.2% Fibonacci expansion at 46.62 opens the door for a test of the 50% level at 45.46. Alternatively, a push above support-turned-resistance at 48.76 (range floor, trend line) paves the way for retest of the August 1 high at 50.40.
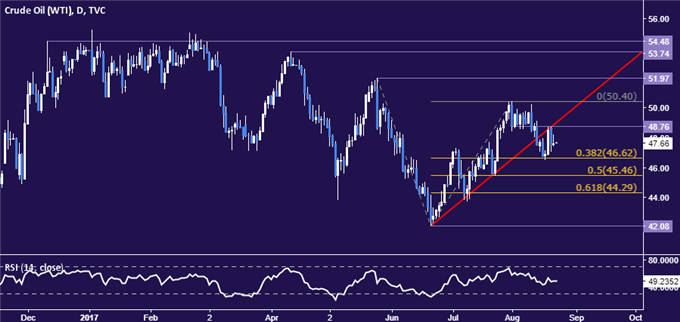
Chart created using TradingView


