
Gold Prices Risk Larger Rebound As Bullish Sequence Unravels
GOLD TALKING POINTS
Gold holds a narrow range even as the ongoing shift in U.S. trade policy shakes up the dollar, and the precious metal may continue to consolidate over the remainder of the week as the recent series of lower highs & lows snap ahead of the October-low ($1183).
GOLD PRICES RISK LARGER REBOUND AS BULLISH SEQUENCE UNRAVELS

It seems as though the current environment will continue to curb the appeal of bullion despite the gridlock in Congress as the Federal Reserve shows little to no interest in scaling back its hiking-cycle.
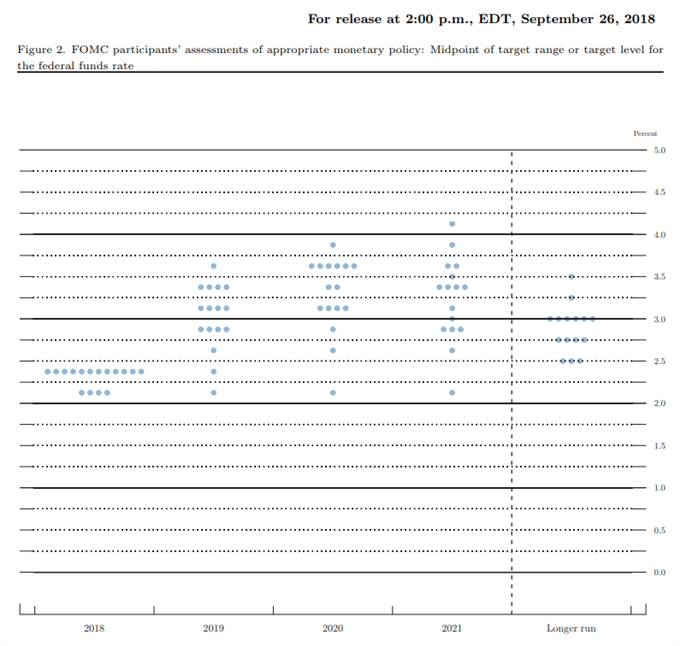
Expectations for higher U.S. interest rates may keep gold prices under pressure ahead of the December meeting as the Federal Open Market Committee (FOMC) is widely anticipated to deliver a 25bp rate-hike, and fresh updates from Chairman Jerome Powell & Co. may ultimately produce headwinds for the precious metal if a growing number of central bank officials see a risk of overshooting the longer-run interest rate forecast of 2.75% to 3.00%.
In fact, there appears to be a growing discussion of extending the hiking-cycle in response to the shift in trade policy as ‘several participants reported that firms in their Districts that were facing higher input prices because of tariffs perceived that they had an increased ability to raise the prices of their products.’ As a result, a growing number of Fed officials may show a greater willingness to temporarily implement above-neutral interest rates, but sentiment surrounding the precious metal remains skewed, with recent developments reflecting a further accumulation in net-long interest.
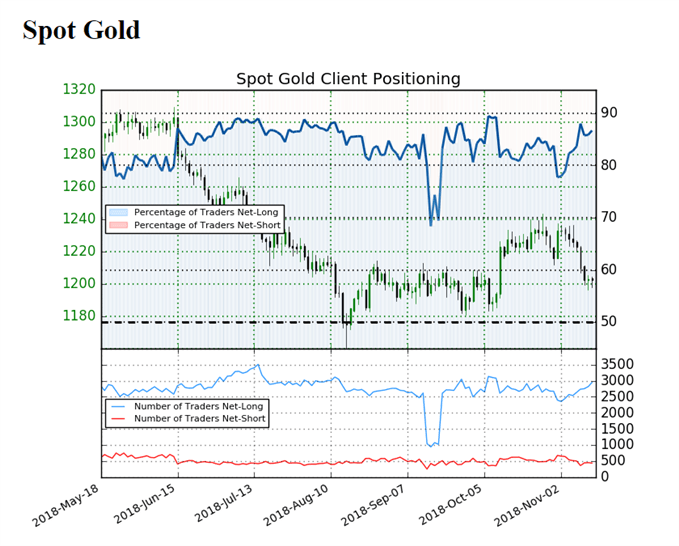
The IG Client Sentiment Report shows 86.7% of traders are now net-long gold compared to 83.5% at the start of the week, with the ratio of traders long to short at 6.52 to 1. The number of traders net-long is 5.7% higher than yesterday and 20.1% higher from last week, while the number of traders net-short is 17.2% lower than yesterday and 31.5% lower from last week.
The persistent tilt in retail position undermines the rebound from the 2018-low ($1160) as it offers a contrarian view to crowd sentiment, but gold prices appears to have marked a failed run at the October-low ($1183), with the precious metal at risk of a larger rebound as it continue to track the upward trending channel from August.
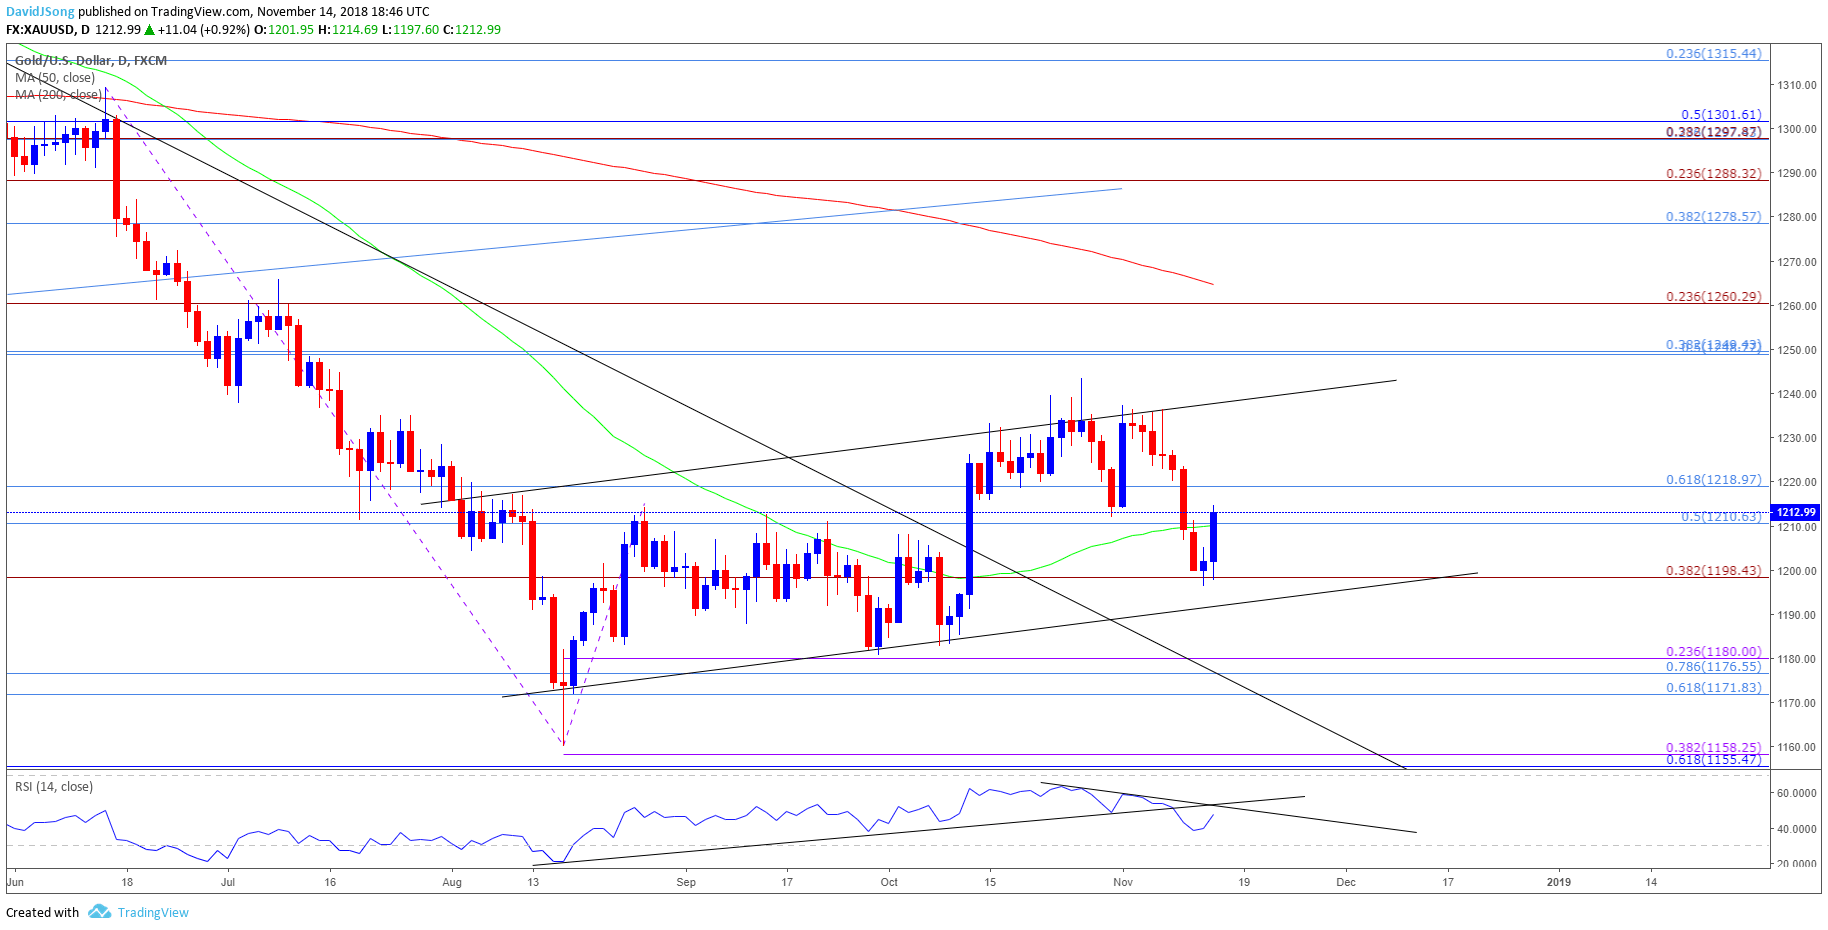
Gold Daily Chart
(Click on image to enlarge)
-
Gold may continue to track the upward trending channel after breaking out downward trend from earlier this year, with a failed attempt to test the October-low ($1183) raising the risk for a move back above the $1210 (50% retracement) to $1219 (61.8% retracement) region.
-
The October-high ($1243) comes up next followed by the Fibonacci overlap around $1249 (50% retracement) to $1250 (38.2% retracement).
Disclosure: Do you want to see how retail traders are currently trading the US Dollar? Check out our IG Client Sentiment ...
more

