Gold Prices Menace Key Support With Fed Freshmen Hearings Due
Gold prices fell as the US Dollar returned to the offensive Monday, rebounding after a corrective pullback as expected. Traders were probably looking for an excuse to even out exposure following three days of downward retracement before Fed nominees Richard Clarida and Michelle Bowman sit for Senate confirmation hearings tomorrow.
The nominal trigger for the greenback’s intraday recovery came from the White House. President Trump signaled Chinese telecom equipment giant ZTE might be allowed back resume doing business in the US after being banned last month. The sentiment was echoed by Commerce Secretary Wilbur Ross. Markets seemingly interpreted the sudden about-face as hinting that a US/China trade war might be avoided after all.
Crude oil prices edged up despite EIA drilling productivity data pointing to added US output. OPEC reported impressively strong compliance of 166 percent with coordinated supply cuts in its monthly report even as shipments from Iran are due to be crimped by re-imposed sanctions after the US pulled out of a multilateral nuclear disarmament deal with the county.
FED HEARINGS, API INVENTORY DATA IN FOCUS
Looking ahead, comments from Mr Clarida and Ms Bowman are likely to overshadow April’s US retail salesreport as the main catalyst driving Fed policy speculation. If they appear to endorse the seemingly more hawkish consensus building on the rate-setting FOMC committee, gold is likely to suffer deeper losses amid ebbing anti-fiat demand as the greenback continues building upward.
Meanwhile, crude oil will look to the weekly set of API inventory flow statistics. That will be weighed up against forecasts calling for a 1.29 million barrel draw to be reported in official DOE statistics on the following day. An especially large US Dollar move may also exert knock-on influence since oil prices are denominated in terms of the benchmark currency on global markets.
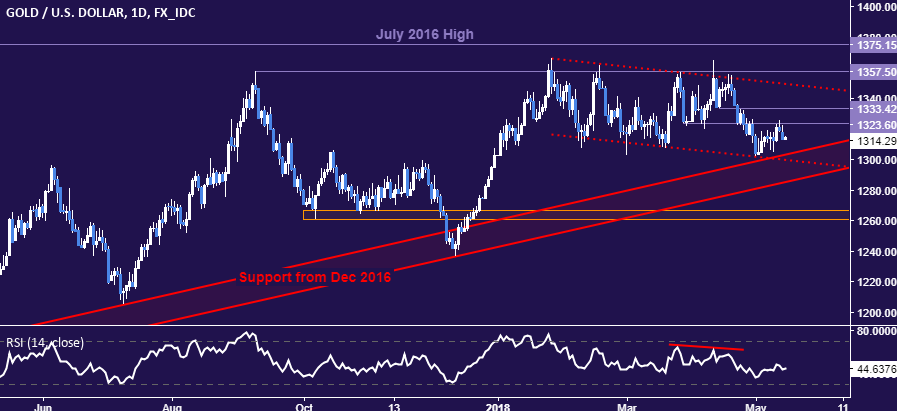
GOLD TECHNICAL ANALYSIS
Gold prices are treading water above rising trend support set from December 2016, now in the 1286.00-1303.33 area. Piercing this would mark a major reversal of the dominant trend and expose the next notable support in the 1260.80-66.44 zone. Alternatively, a daily close above support-turned-resistance in the 1323.60-33.42 region targets the confluence of a double top and falling channel ceiling in the 1349.31-57.50 area.
(Click on image to enlarge)
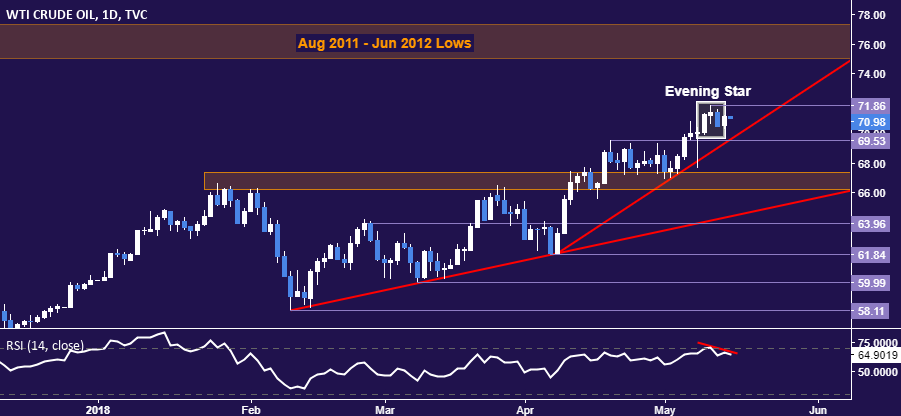
CRUDE OIL TECHNICAL ANALYSIS
Crude oil prices continue to show signs of topping, with a bearish Evening Star candlestick pattern reinforced by negative RSI divergence. A breach of support at 69.53 (trend line, former range top) exposes resistance-turned-support in the 66.22-67.36 area. Alternatively, a daily close through the May 10 high at 71.86 would invalidate the bearish setup and put the spotlight ton resistance in the 75.00-77.31 zone, marked by major swing bottoms set in August 2011 and June 2012.
(Click on image to enlarge)