
Gold Prices May Turn Lower On Upbeat Fed Beige Book
Gold prices rose for a second day, echoing a drop in Treasury bond yields that bolstered the appeal of non-interest-bearing alternatives. That has accompanied increased haven demand for US government debt as initial optimism following the weekend’s G20 leaders’ summit comes undone. Indeed, the bellwether S&P 500 stock index suffered the largest drop in two months Tuesday.
A rebound in the US Dollar capped the yellow metal’s gain’s however. The greenback roared higher after touching a two-week low intraday on convincingly hawkish comments from New York Fed President John Williams. He painted a rosy view of growth and inflation, arguing that gradual rate hikes will remain appropriate for the next year or so.
The Greenback’s recovery coupled with sentiment-derived headwinds with weigh on crude oil prices. The WTI contract began to succumb to de-facto selling pressure as the currency rose from its intraday low and accelerated downward as stocks crumbled. News that Aramco – Saudi Arabia’s state-owned oil company – cut prices on crude exports to Asia probably amplified the down move.
FED BEIGE BOOK MIGHT WEIGH ON COMMODITY PRICES
Looking ahead, the Fed’s Beige Book survey of regional economic conditions is due to cross the wires. The report make take on new significance as markets try to make sense of the US central bank’s new messaging strategy. An upbeat tone signaling confidence in the pace of economic activity may boost rate hike bets, pushing USD higher and weighing on commodities by extension.
GOLD TECHNICAL ANALYSIS
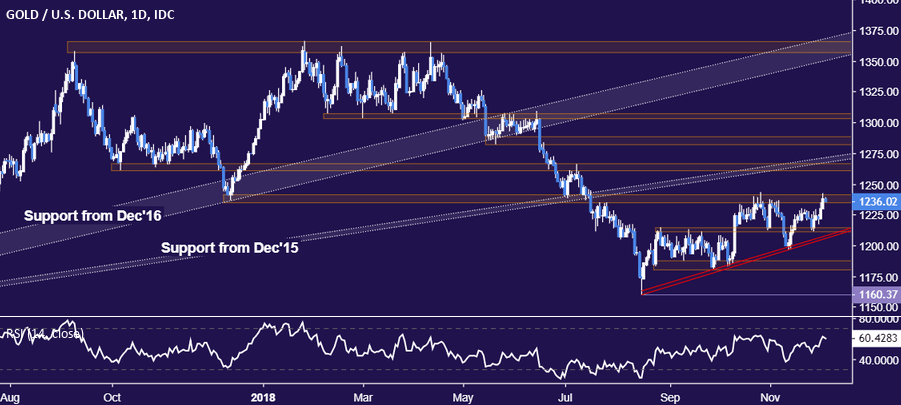
Gold prices are testing resistance in the 1235.24-41.64 area once again. A break above it confirmed on a daily closing basis opens the door for a challenge of the 1260.80-66.44 zone. Alternatively, a move below rising trend support at 1206.22 targets the range floor in the 1180.86-87.83 region.
(Click on image to enlarge)
CRUDE OIL TECHNICAL ANALYSIS
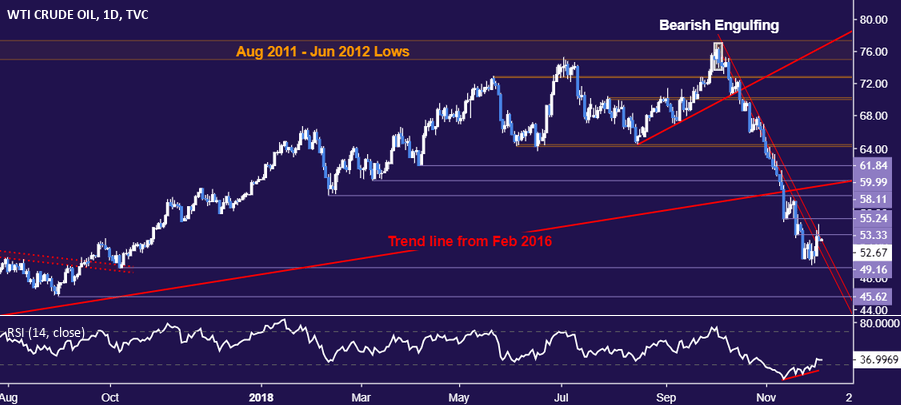
Crude oil prices put in a Shooting Star candlestick on a test of resistance at 53.33 (former support, falling trend line), pointing to indecision and hinting a turn lower may be ahead. A reversal below 49.16 (October 9, 2017 low) sees the next downside barrier at 45.62 (August 31, 2017 low). Alternatively, a daily close above 53.33 initially exposes former support at 55.24.
(Click on image to enlarge)
Disclosure: Do you want to see how retail traders are currently trading the US Dollar? Check out our IG Client Sentiment ...
more

