
Gold Prices May Rise As Soft US GDP Cools Fed Rate Hike Bets
Gold prices are adrift in familiar territory, mirroring consolidation in the US Dollar and the priced-in 2017 rate hike path implied in Fed Funds futures. The spotlight now turns to first-quarter US GDP figures. Consensus forecasts point to an annualized gain of 1 percent, a steep slowdown from the 2.1 percent recorded in the three months through December 2016.
A closely-watched forecast of US growth from the Atlanta Fed suggests the result may be more disappointing still. Its GDPNow model projects performance that is materially worse than even the low end of market estimates. Meanwhile, data from Citigroup shows US economic news-flow underperforming relative to consensus bets by a widening margin recently, bolstering the case for a downside surprise.
Soft GDP data may weigh against Fed rate hike bets. While the markets are not seriously contemplating a hike next month, the probability of one in June is priced in at nearly 70 percent. With confidence in a potent fiscal boost receding, the markets may conclude that a significant dip growth will delay tightening at least until the second half of the year, boosting the appeal of non-interest-bearing assets including gold.
Crude oil prices sank after news that Libya restarted production at the Shahara field, the country’s largest, and plans to bring the Waha field online by mid-June. Losses were short-lived however as markets weighed up conflicting cues from the International Oil Summit in Paris. OPEC Secretary-General Mohammad Barkindo talked up progress on draining inventories and predicted a balanced market later this year.
Another batch of statistics showing the relentless swell in swing production may revive selling pressure however. Taken together,EIA monthly supply figures and the weekly Baker Hughes rig count reporttracking the number of active US extraction sites may serve as a potent reminder of the cartel’s diminishing influence as swing production grows.
GOLD TECHNICAL ANALYSIS – Gold prices are waiting for fresh direction cues having slid to a two-week low after topping near the $1300/oz threshold (as expected). From here, a daily close below the 14.6% Fibonacci expansion at 1258.62 targets the 1235.91-41.50 area (October 7 2016 low, 23.6% level). Alternatively, a push above falling trend line resistance at 1287.01 exposes the 295.46-1308.00 region (April 17 high, support-turned-resistance).
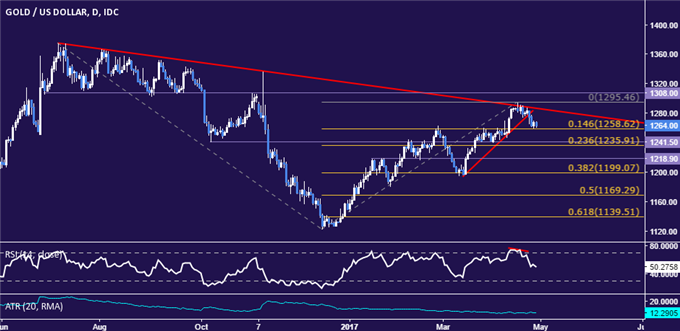
Chart created using TradingView
CRUDE OIL TECHNICAL ANALYSIS – Crude oil prices dipped to the lowest level in a month but failed to secure a break below trend line support set from August 2016. Confirmation of a breach below the 48.74-85 area (trend line, 61.8% Fibonacci expansion) on a daily closing basis exposes the 47.08-69 zone (March 22 low, 76.4% level). Alternatively, a reversal above the 50% Fib at 49.78 opens the door for a retest of 50.71, the 38.2% expansion.
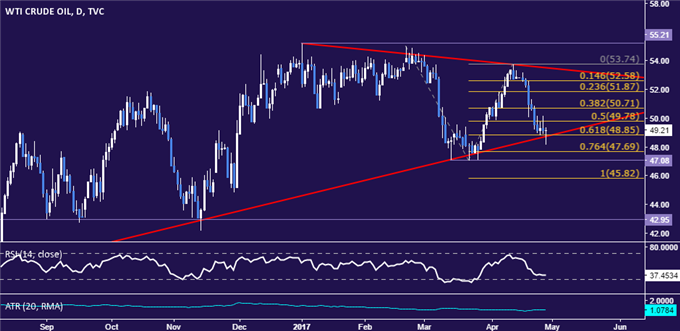
Chart created using TradingView
Disclosure: Have a question about trading the US Dollar? more


