
Gold Prices May Finally Break Trend Support On Hawkish Fed
Gold prices retreated as the US Dollar posted the largest increase in two weeks, extending its winning streak to a fourth consecutive day and undercutting the appeal of anti-fiat alternatives. An upshift in the priced-in 2019 interest rate hike path implied in Fed Funds futures looks to have accounted for the move. In-line US CPI data passed largely unnoticed, as expected.
Crude oil prices edged down as a monthly report from OPEC flagged uncertainly about on-coming supply and demand dynamics while the EIA upgraded its forecast for US output. Meanwhile, unnamed sources claimed Russia wants to scale back production curbs to October 2016 levels. API also reported US inventories added 833k barrels last week.
HAWKISH FED MAY HURT COMMODITY PRICES
Looking ahead, the FOMC monetary policy announcement is firmly in focus. Leading survey data points to a steep pickup in economic activity and accelerating inflation since the March forecast update, which might make for a hawkish tilt. That is likely to bode ill for gold prices as the US Dollar continues to march higher while broader capital flows move away from non-interest-bearing assets.
The official set of EIA inventory flow statistics is also due. It is expected to show that crude stockpiles shed 1.09 million barrels last week. A print closer in line with the API projection might pressure oil prices downward. A stronger greenback might amplify any such move since the commodity is priced in USD terms on global markets.
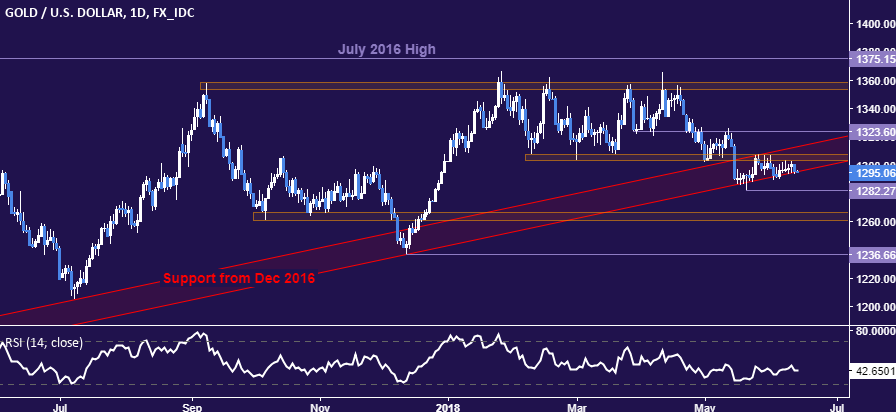
GOLD TECHNICAL ANALYSIS
Gold prices await clarify at support set from December 2016, now at 1294.89. A breakdown confirmed on a daily closing basis initially exposes the May 21 low at 1282.27, followed by the 1260.80-66.44 area. Alternatively, a push above the 1302.97-07.32 area aims for the upper layer of trend support (1312.82) and a chart inflection point at 1323.60.
(Click on image to enlarge)
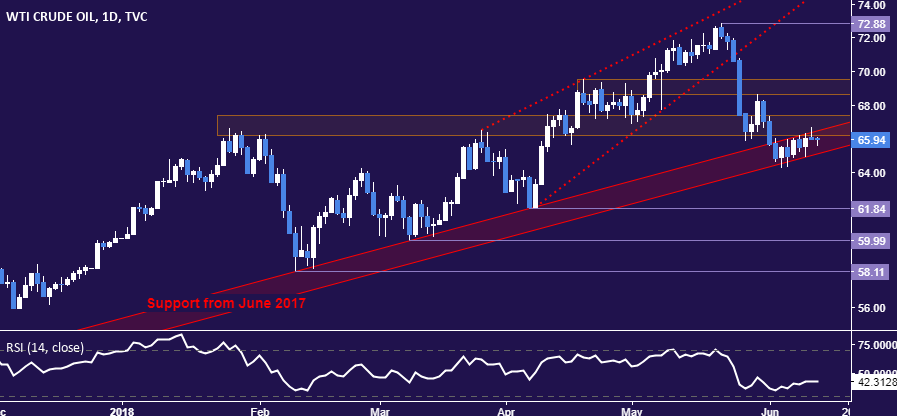
CRUDE OIL TECHNICAL ANALYSIS
Crude oil prices are trying to resolve a clear directional bias at support set from June 2017. A break of its outer layer, now at 65.12, opens the door for a test of the April 6 low 61.84. Alternatively, a rebound back above resistance in the 66.22-67.36 area targets the 68.64-69.53 region next.
(Click on image to enlarge)
Disclosure: Do you want to see how retail traders are currently trading the US Dollar? Check out our IG Client Sentiment ...
more

