
Gold Prices Drop As Markets Set Sights On Trump Tax Plan
Gold prices sank as firming risk appetite sapped haven demand for Treasury bonds and drove yields higher. Investors’ chipper mood also echoed into US monetary policy expectations, with the 2017 rate hike path implied in Fed Funds futures now at its steepest in three weeks. Not surprisingly, this proved damaging for non-interest-bearing assets.
The Euro marched higher alongside US share prices and bond yields as the yellow metal sank, hinting that the markets’ optimism continued to reflect outcome of the first round of France’s presidential election. The spotlight will move across the Atlantic in the day ahead as the “Trump trade” narrative resurfaces with the announcement of a White House tax reform proposal.
This is a pivotal part of the post-election narrative predicting faster Fed rate hikes as expansionary fiscal policy boosts inflation. That means markets will be keen to assess the plan’s merit and pass-ability. Preliminary whispers making the rounds across the wires suggest the President will propose a 10 percent tax rate on repatriated earnings and slash the baseline corporate rate from 35 to 15 percent.
The scheme’s apparent focus on lowering rates even at the expense of growing the budget deficit as well as its omission of the controversial border adjustment tax may set up a clash with conservatives in the House of Representatives. Fed rate hike bets may cool if traders sense that it may face the same fate as the aborted AHCA healthcare reform effort, offering gold a lifeline.
Crude oil prices paused to digest after dropping to the lowest level in a month. Intraday gains fizzled after API reported that inventories added 897k barrels last week. Official EIA inventory data is next on tap, with a 1.14 million barrel draw projected. A print closer to the API estimate may stoke suspicions that swelling swing supply will offset OPEC production cut efforts, rekindling selling pressure.
GOLD TECHNICAL ANALYSIS – Gold prices accelerated lower having topped below the $1300/oz figure as expected. Near-term support is now at 1258.62, the 14.6% Fibonacci expansion, with a daily close below that targeting the 1235.91-41.50 area (October 7 2016 low, 23.6% level). Alternatively, a push above falling trend line resistance at 1287.01 exposes the 1295.46-1308.00 zone (April 17 high, support-turned-resistance).
(Click on image to enlarge)
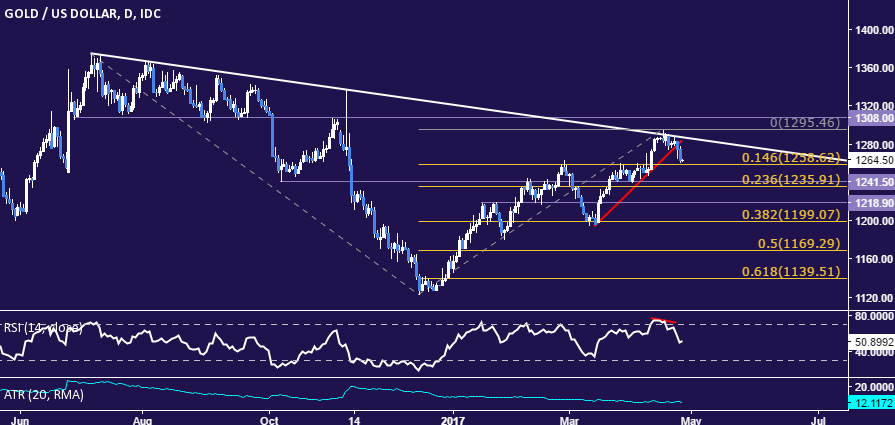
Chart created using TradingView
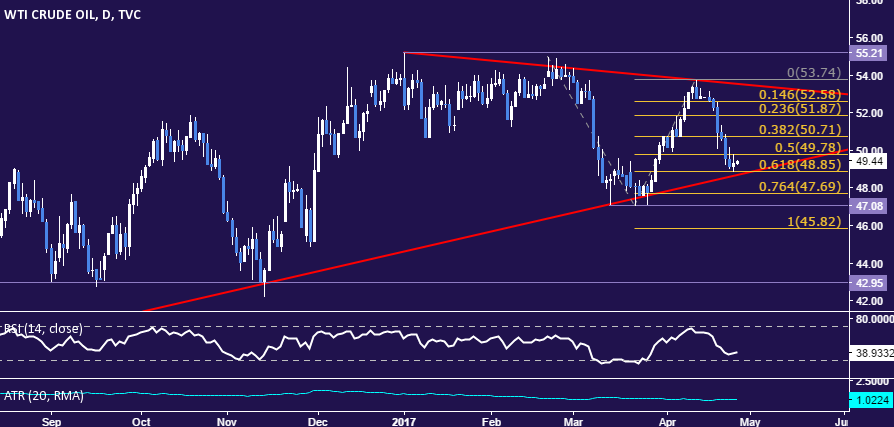
CRUDE OIL TECHNICAL ANALYSIS – Crude oil prices snapped a six-day streak, pausing to consider their next move above rising trend support set from early August 2016. A daily close below the 48.68-85 area (trend line, 61.8% Fibonacci expansion) exposes the 47.08-69 zone (March 22 low, 76.4% level). Alternatively, a push back above the 50% Fib at 49.78 targets the 38.2% expansion at 50.71.
(Click on image to enlarge)
Disclosure: Have a question about trading the US Dollar? more


