
Gold Price Technical Outlook: Bulls Pause After $1250 Test
Gold has rallied more than 2% since the start of December with advance testing five-month highs early in the week. The risk for near-term weakness remains but the broader outlook remains constructive with prices carving out a well-defined weekly opening-range just below trendline resistance. These are the updated targets and invalidation levels that matter on the XAU/USD charts into the close of the week.
GOLD DAILY PRICE CHART (XAU/USD)
(Click on image to enlarge)
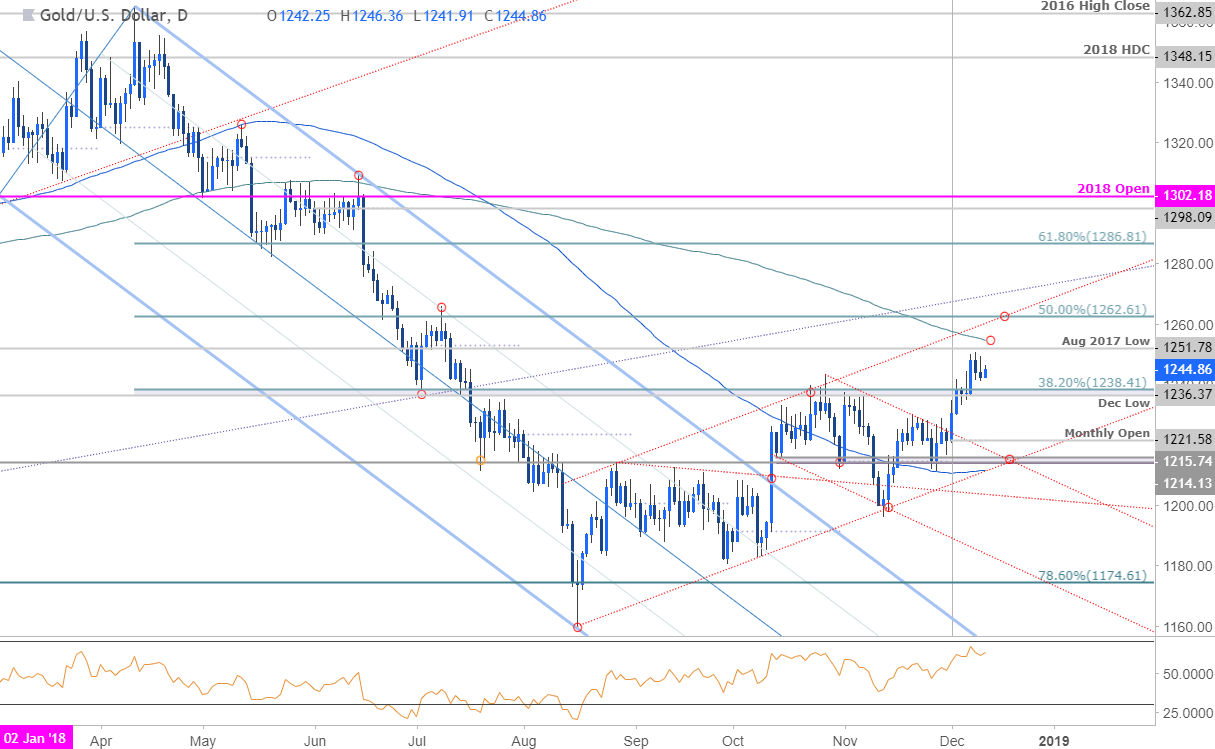
Technical Outlook: In our last Gold Technical Outlook we noted that price had broken above a critical resistance barrier in XAU/USD at 1236/38 with our focus higher while above the monthly open at 1221. Gold turned just ahead of the August 2017 low at 1252 with the weekly opening-range taking shape just below and we’re looking for the break for guidance.
GOLD 240MIN PRICE CHART (XAU/USD)
(Click on image to enlarge)
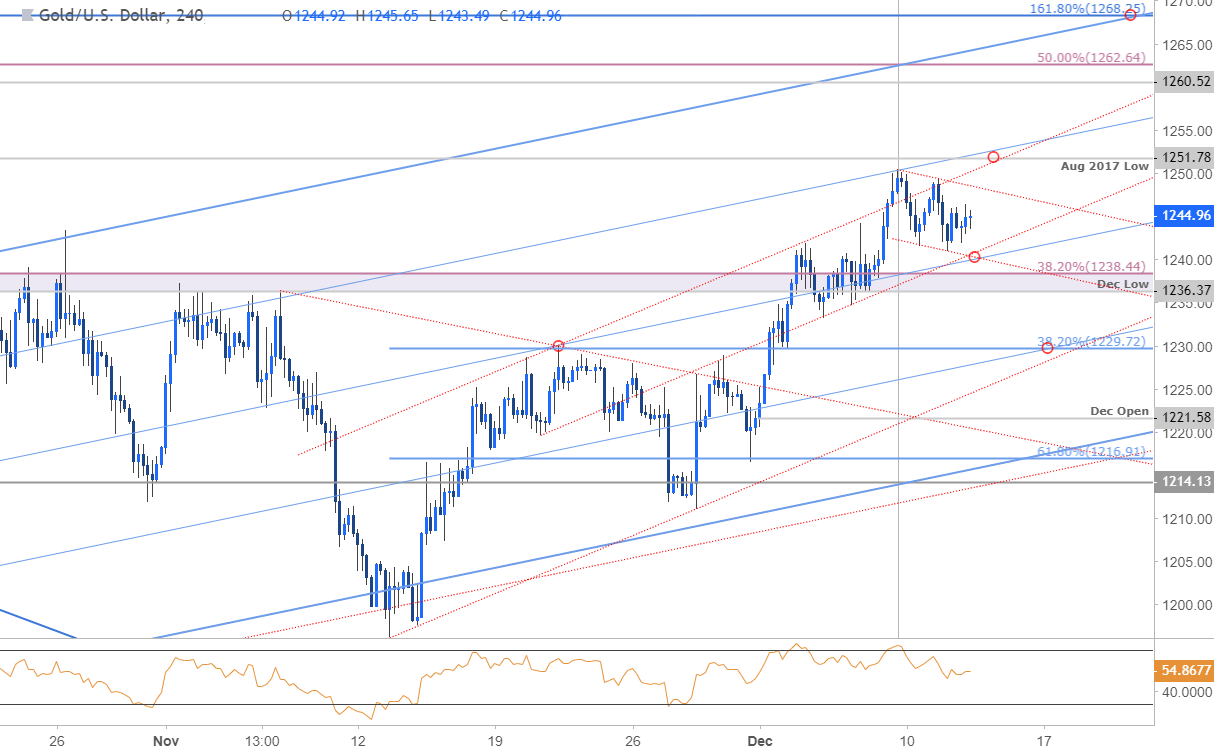
Notes: A closer look at price action sees the advance continuing to trade within the confines of an ascending pitchfork formation extending off the yearly lows with gold pulling back from the 75% line early in the week. Initial support rests at the highlighted trendline confluence backed by the 1236/38 support pivot.
Bullish invalidation now raised to the 38.2% retracement at 1229 – a weakness beyond this threshold would risk a larger correction towards the lower parallels broader bullish invalidation steady at 1214/15. Topside targets are unchanged with a breach through near-term channel resistance targeting 1252 backed by 1260 and the 50% retracement of the yearly range at 1262.
Bottom line: Gold is responding to up-slope resistance and while we could see some near-term weakness, the focus remains higher while above within this formation. From a trading standpoint, be on the lookout for price exhaustion while above 1236 with a breach above 1252 needed to fuel the next leg higher in gold. IF we get a deeper pullback, look for more favorable entries towards slope support next week.
GOLD TRADER SENTIMENT
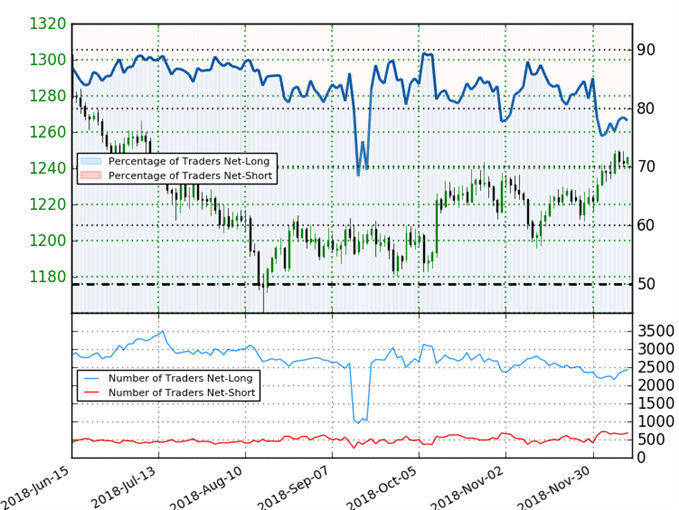
- A summary of IG Client Sentiment shows traders are net-long Gold - the ratio stands at +3.53 (77.9% of traders are long) – bearish reading
- Long positions are0.6% lower than yesterday and 9.8% higher from last week
- Short positions are 3.0% higher than yesterday and 1.6% lower from last week
- We typically take a contrarian view to crowd sentiment, and the fact traders are net-long suggests Gold prices may continue to fall. Yet traders are less net-long than yesterday but more net-long from last week and the combination of current positioning and recent changes gives us a further mixed Gold trading bias from a sentiment standpoint.
Disclosure: Do you want to see how retail traders are currently trading the US Dollar? Check out our IG Client Sentiment ...
more


Silver has gotta catch up.