
Gold Price Forecast: Bearish RSI Signals Warn Of Further Losses
GOLD TALKING POINTS
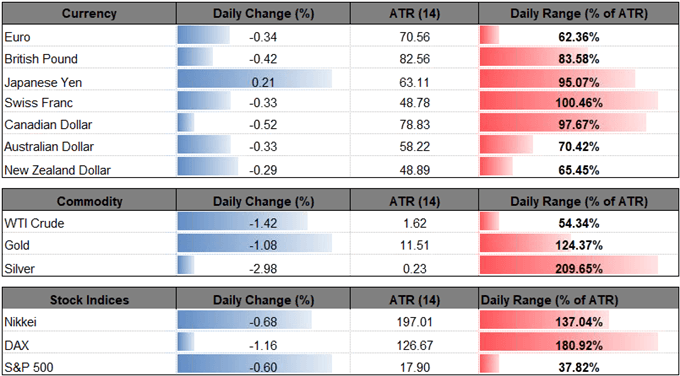
Gold prices are back under pressure amid the recent strength in the U.S. dollar, and the precious metal stands at risk for further losses as the bearish momentum appears to be gathering pace.
(Click on image to enlarge)
GOLD PRICE FORECAST: BEARISH RSI SIGNALS WARN OF FURTHER LOSSES
(Click on image to enlarge)

The inverse relationship between gold and the U.S. dollar may become more evident despite the growing threat of a global trade war as fresh data prints coming out of the U.S. economy instills an improved outlook for growth and inflation.
Updates to the U.S. Retail Sales report showed household spending increasing 0.5% in July amid forecasts for a 0.1% print, and signs of stronger consumption should keep the Federal Open Market Committee (FOMC) on track to implement higher borrowing costs as the central bank largely achieves its dual mandate for full employment and price stability.
(Click on image to enlarge)
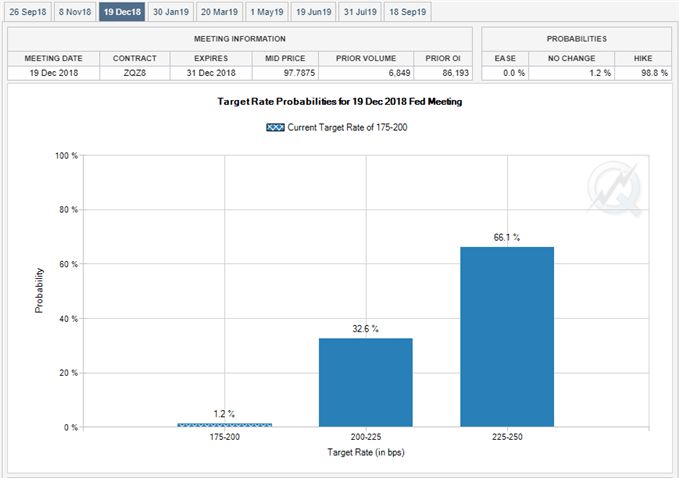
As a result, the FOMC may deliver a hawkish rate-hike in September as ‘the Committee expects that further gradual increases in the target range for the federal funds rate will be consistent with sustained expansion of economic activity, strong labor market conditions, and inflation near the Committee's symmetric 2 percent objective over the medium term,’ with gold prices at risk of facing additional headwinds ahead of the next quarterly meeting as Fed Fund Futures continue to reflect expectations for four rate-hikes in 2018.
(Click on image to enlarge)
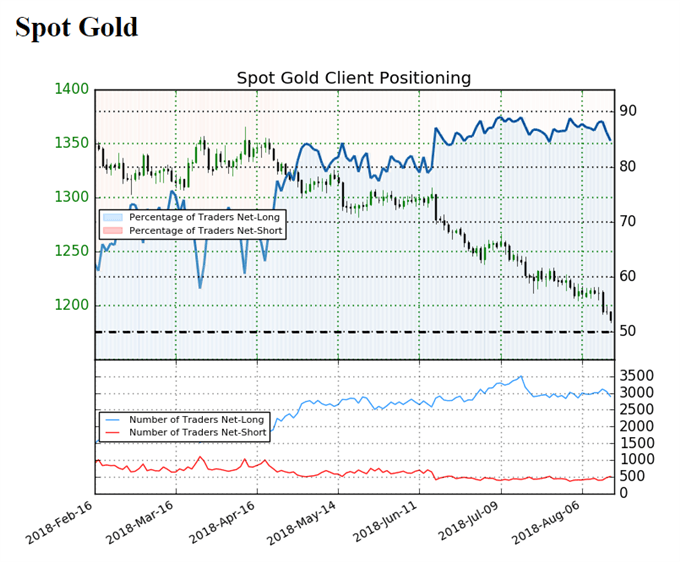
Downside targets are back on the radar for gold as it snaps the narrow range from earlier this month, with the IG Client Sentiment Report still showing retail sentiment near extremes even as gold prices trade to fresh yearly lows. Retail trader data shows 84.7% of traders are still net-long gold with the ratio of traders long to short at 5.54 to 1. The number of traders net-long is 7.4% lower than yesterday and 3.1% lower from last week, while the number of traders net-short is 14.5% higher than yesterday and 8.5% higher from last week.
The ongoing skew in retail positioning offers a contrarian view to crowd sentiment, with the broader outlook for gold still tilted to the downside as both price and the Relative Strength Index (RSI) extend the bearish formations from earlier this year.
GOLD DAILY CHART
(Click on image to enlarge)
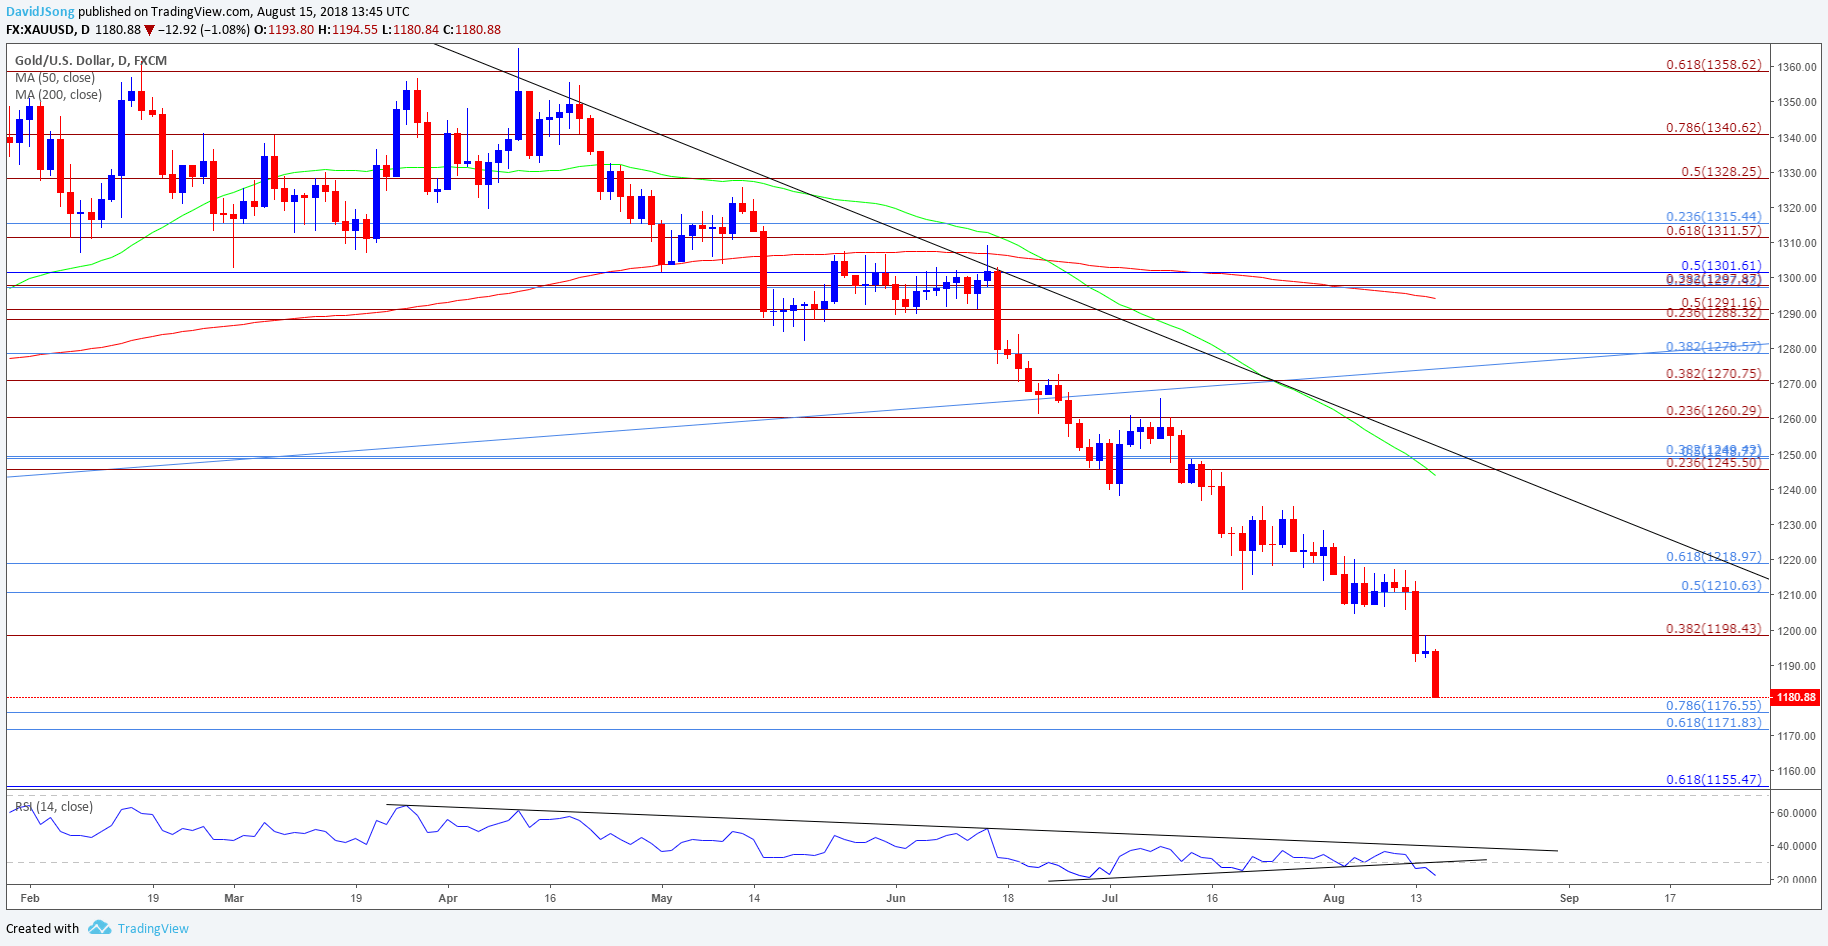
- Gold prices remain vulnerable amid the ongoing string of lower highs, with the break/close below $1198 (38.2% expansion) opening up the Fibonacci overlap around $1172 (61.8% retracement) to $1177 (78.6% retracement); next downside hurdle comes in around $1156 (61.8% retracement) followed by the 2017-low ($1146).
- Keeping a close eye on the RSI as it snaps the upward trend from late-June, with recent developments in the oscillator highlighting a bearish outlook for gold prices as the indicator breaks below 30 and pushes into oversold territory.


