Thursday, May 17, 2018 4:08 AM EDT
Commodity prices corrected higher amid a broad-based retracement of Tuesday’s price action across benchmark asset classes. Gold prices edged up as the US Dollar retreated after setting a fresh four-month high, boosting the appeal of anti-fiat alternatives. Meanwhile, crude oil prices followed the bellwether S&P 500 stock index upward.
BARE CALENDAR MAY BOOST HEADLINE SENSITIVITY
Looking ahead, a lull in top-tier scheduled event risk might make for a day of consolidation. Crude oil might see a bit of knee-jerk volatility as June WTI options expire. The absence of a clear catalyst might make for elevated sensitivity to stray headline risk however, so traders would be wise to proceed with caution.
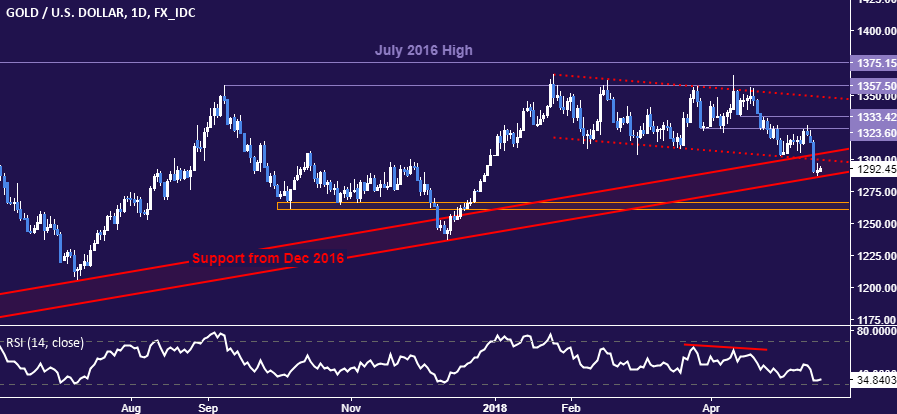
GOLD TECHNICAL ANALYSIS
Gold prices continue to test the outer layer of support guiding them higher since December 2016, now at 1286.55. A daily close below that exposes the 1260.80-66.44 area. Alternatively, a push back above 1304.32 opens the door for a retest of support-turned-resistance in the 1323.60-33.42 zone.
(Click on image to enlarge)
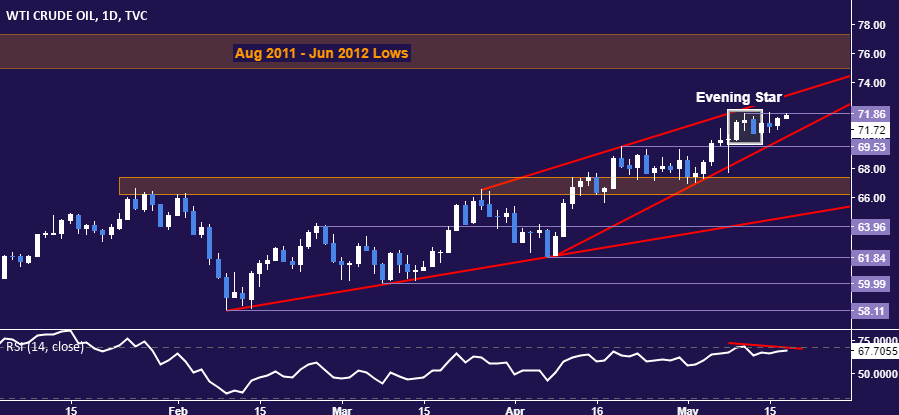
CRUDE OIL TECHNICAL ANALYSIS
A bearish Evening Star candlestick pattern coupled with negative RSI divergence continue to hint that a top is in the works. A turn back below resistance-turned-support at 69.53 exposes the 66.22-67.36 area anew. Alternatively, a daily close above the May 10 high at 71.86 eyes wedge pattern resistance at 73.11.
(Click on image to enlarge)
Disclosure: DailyFX, the free news and research website of leading forex and CFD broker FXCM, delivers up-to-date analysis of the ...
more
Disclosure: DailyFX, the free news and research website of leading forex and CFD broker FXCM, delivers up-to-date analysis of the fundamental and technical influences driving the currency and commodity markets. With nine internationally-based analysts publishing over 30 articles and producing 5 video news updates daily, DailyFX offers in-depth coverage of price action, predictions of likely market moves, and exhaustive interpretations of salient economic and political developments. DailyFX is also home to one of the most powerful economic calendars available on the web, complete with advanced sorting capabilities, detailed descriptions of upcoming events on the economic docket, and projections of how economic report data will impact the markets. Combined with the free charts and live rate updates featured on DailyFX, the DailyFX economic calendar is an invaluable resource for traders who heavily rely on the news for their trading strategies. Additionally, DailyFX serves as a portal to one the most vibrant online discussion forums in the forex trading community. Avoiding market noise and the irrelevant personal commentary that plague many forex blogs and forums, the DailyFX Forum has established a reputation as being a place where real traders go to talk about serious trading.
Any opinions, news, research, analyses, prices, or other information contained on dailyfx.com are provided as general market commentary, and does not constitute investment advice. Dailyfx will not accept liability for any loss or damage, including without limitation to, any loss of profit, which may arise directly or indirectly from use of or reliance on such information.
** All times listed in GMT. See the full DailyFX economic calendar here.
less
How did you like this article? Let us know so we can better customize your reading experience.


