
Gold Price Analysis: Closer To A Significant Monetary Event
Previously, I have shown how we could be close to major financial crisis with the monetary system at the center. The following chart that shows the ratio of gold to the monetary base was used:
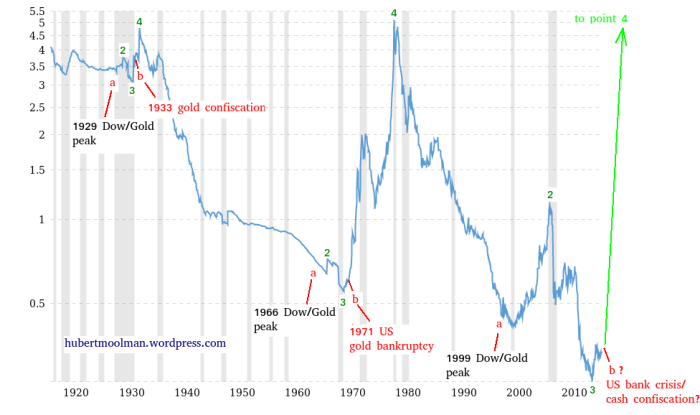
The chart shows the ratio of the gold price to the St. Louis Adjusted Monetary Base back to 1918. That is the gold price in US dollars divided by the St. Louis Adjusted Monetary Base in billions of US dollars. (from macrotrends.com)
You can get more details about the chart and the commentary here.
It would seem that we are now closer to point b, where that major monetary event could start to happen. An event similar to the 1933 gold confiscation (bankruptcy) and the 1971 announcement where the US ended the dollar convertibility to gold (at a fixed rate).
The stock market was always going to be the trigger for this event, and it is now very extended. When it falls over, we can almost be sure that big financial pain is coming.
Below, is a more short-term chart of the ratio of the gold price to the monetary base:
(Click on image to enlarge)
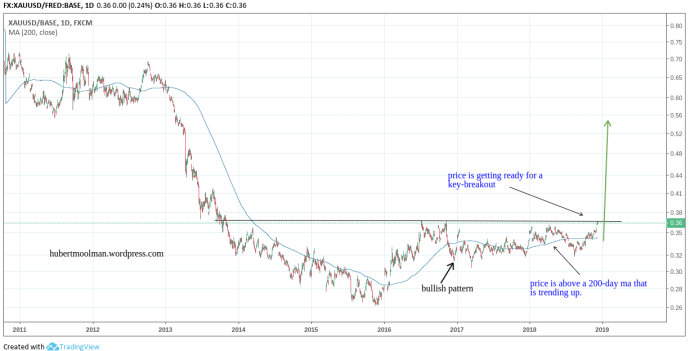
The ratio is getting ready to pop. There is no certainty when the crisis would hit; however, it will come some time during the rally and after/during the stock market crash. Physical gold and silver will likely be key assets during this crisis.
For more on this and this kind of fractal analysis, you are welcome to subscribe to my premium service. I have also ...
more

