
Gold Could Retrace Some Short Term
- SPX Monitoring purposes; Long SPX on 4/24/17 & 2374.15
- Monitoring purposes Gold: Neutral
- Long Term Trend monitor purposes: Neutral
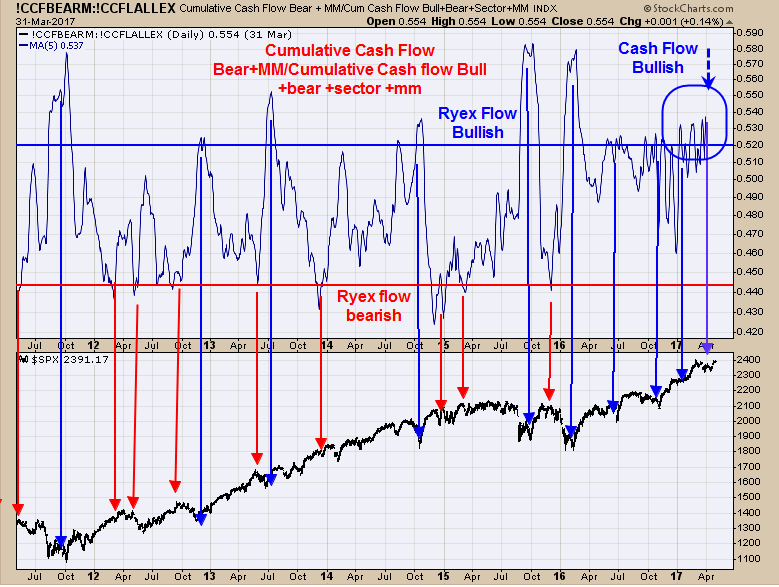
Above are the Cumulative Cash Flow Bear + money market/Cumulative Cash Flow bull + bear + Sector + money market. When this five period moving average ratio is above .52 (current reading is .5337) the market is usually stable. Market can correct but the corrections are usually limited to less than 5% and in most cases less than 3%. FOMC meeting is tomorrow which could produce short term volatility. A spike higher could produce a short term top. Long SPX on 4/24/17 at 2374.15.
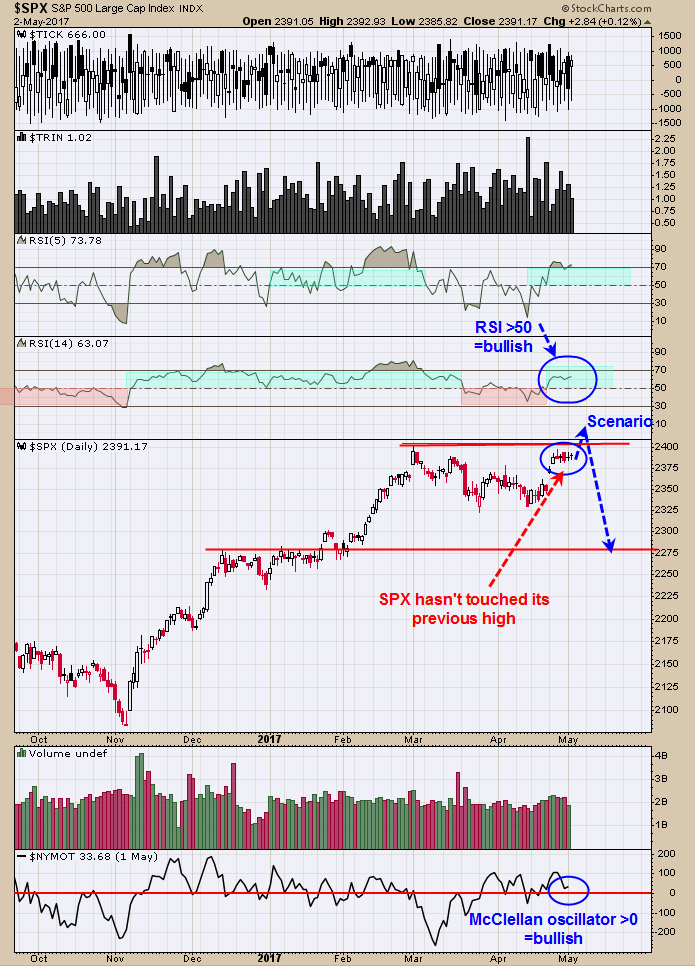
The bottom window is the McClellan oscillator which is >0 and bullish. The RSI for SPX is above 50 and remains bullish. Over the last week the SPX has been hovering right below the March 1 high and not backing away suggesting market is building “cause” to break above the March 1 high. The TRIN closed yesterday at 1.31 and the Tick closed at -291 and in the past that combination has lead to short term rallies in the SPX. With the market quiet the last few days and the FOMC meeting is tomorrow, the market may produce short term volatility. A break to new short term high is possible that may turn into a short term top.
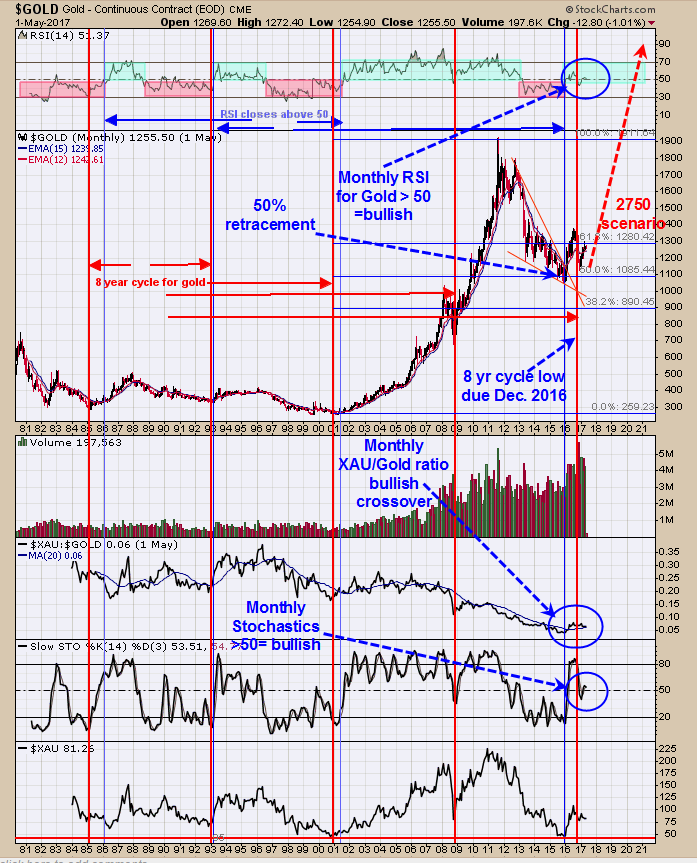
Above is the longer term view for gold. The top window is the monthly RSI for Gold. Monthly RSI above 50 suggests major trend is up in gold and below 50 a major downtrend; RSI close at 51.37. The red vertical lines on the Gold chart represent the 8 year cycle for gold bottoms. The last one came in December 2016 suggesting this major cycle has bottom for gold. In bull markets; gold stocks outperform gold and that happens when the XAU/Gold ratio is rising. This ratio had a bullish crossover in early 2016. Next window down is the monthly Slow Stochastics for Gold. In bull markets the Slow Stochastics stays above 50 and the current reading is 53.51. Gold retraced 50% of the move form the 2000 low to the 2011 high at December 2015 low. A Fibonacci 50% retracement suggests the December 2015 low is the half way point of the move up suggesting gold could reach 2750 range (sec chart above). Gold could retrace some short term but the monthly charts remain on a sold buy signal. The monthly charts remain bullish.


