
Gold Consolidation Since Early July About To End
1. Market Update
It´s been more than six weeks since my last report but we have not missed anything in the markets. Sometimes it´s good and necessary to take a healthy break - especially during summer doldrums...
Actually, gold has been moving sideways and is still within a multi-month consolidation pattern since early July. There was no reason to chase gold. Yet nothing to worry about it neither. Instead, I think this will come to an end rather soon.
I have prepared a monthly chart of gold to show you that the uptrend is currently locked-in and will very very likely continue. On the daily chart, you will see that a new rally should start very soon - probably within the next couple of days. My Gold model just went to a neutral stance but I guess this is due to the trend-less period over the last 10 weeks.
While gold has been confusing but held up well, the mining sector has been facing its first serious pullback since last October. To me, it´s already a dip to buy and I will come up with some new recommendations and special reports soon.
There was also a nasty crash in Bitcoin as the world´s largest cryptocurrencies exchange Bitfinex got hacked. In a dramatic sell-off, the price for one Bitcoin plunged from $655 down to $465 in early august. Right before the robbery I warned of a pullback due to a Bollinger Band squeeze. But of course, I did not know that Bitfinex would be the subject to one of the largest Bitcoin hacks ever. Bitcoin is still an experiment and nobody knows how it will play out exactly. But I continue to see huge potential and urge you to take a look at this infographic "what leaders say about bitcoin". Now after some time has passed the price of Bitcoin has nearly recovered to its pre-crash level and in retrospective, the "crash" was just a test of the breakout- and former resistance zone. At the same time, thanks to the crash our buy-order for Ether has been triggered and we are up already more than 50%!
2. The Midas Touch Gold Model neutral since 15th of September
(Click on image to enlarge)
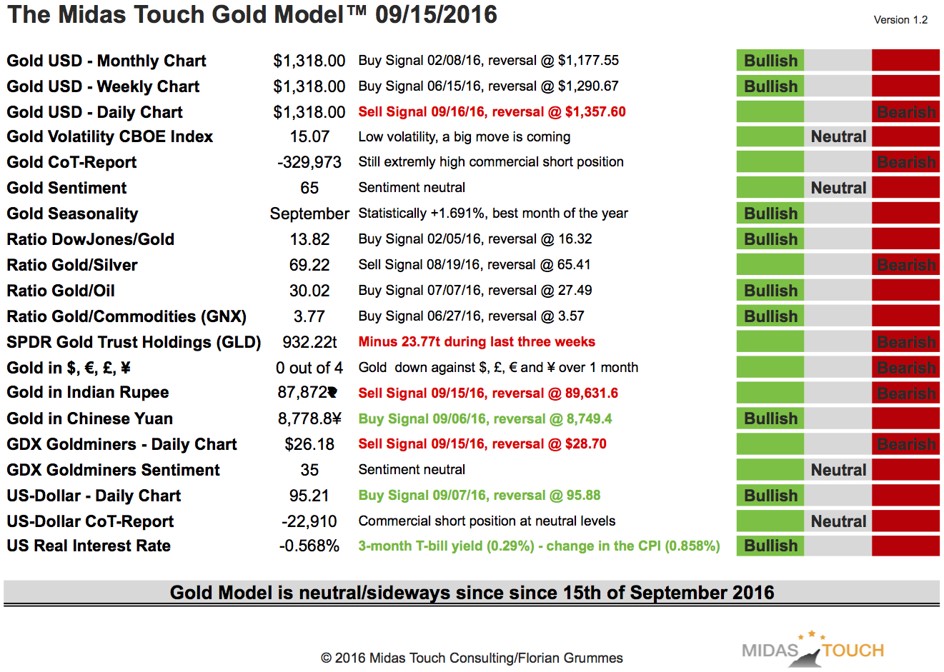
Compared to last week we have the following bullish changes:
Gold in Chinese Yuan
US-Dollar - Daily Chart
US Real Interest Rate (keeps digging deeper into negative territory)
Four new bearish signals:
Gold in US Dollar - Daily Chart
SPDR Gold Trust Holdings
Gold in Indian Rupee
GDX Gold miners - Daily Chart
One neutral signal:
GDX Gold miners - Sentiment
Here are the model´s latest conclusions:
Bullish: 24th of June 2016
Neutral: 22nd of August 2016
Bullish: 6th of September 2016
Neutral: 15th of September 2016
Remember, the model is mainly a trend-following approach. Now that gold is trendless consolidating sideways since more than two months already the model will get into trouble.
3. Gold - Slow Stochastic bullish embedded on the monthly chart
(Click on image to enlarge)
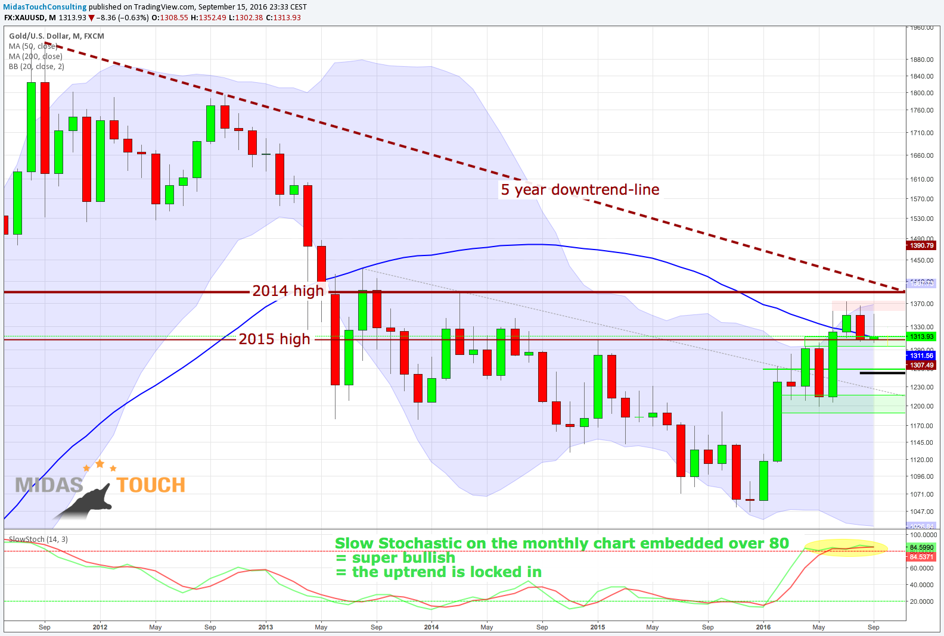
Besides all the short-term noise and the ongoing consolidation the monthly chart for gold is delivering the strongest bull signal I know of!
The Slow Stochastic indicator is a range bound momentum oscillator which usually is moving between overbought and oversold. It´s designed to compare the high/low range over a user defined number of periods. Typically the Stochastic oscillator is used to identify overbought and oversold levels, spotting divergences and also getting buy/sell signals due to its crossing lines. But the indicator has another skill that not many traders and investors are aware of. Once the two signal-lines are moving for more than 3 periods above 80 (overbought) or below 20 (oversold) the oscillator converters into a trend-confirming powerhouse. In that rare so called "embedded" status the ongoing trend is locked-in and will very very likely continue besides any overbought or oversold conditions.
Since the latest candlestick on the monthly gold chart we have exactly this rare condition: the Slow Stochastic is bullish embedded on the monthly chart. That doesn't mean that Gold can not fall $20-50 within a couple of days but by the end of the month we should see a green candlestick. So the uptrend is locked-in and will continue for the next couple of months! Gold is moving higher no matter how overbought it may seem!
The conclusion is very simple: This rare setup will push gold towards $1,500 - $1,530 until end of this year or latest spring 2017. The pullbacks will remain shallow and short-lived! Buy every dip! Gold will not move substantially below $1,300 anymore....
4. Gold - Consolidation since early July about to end
(Click on image to enlarge)
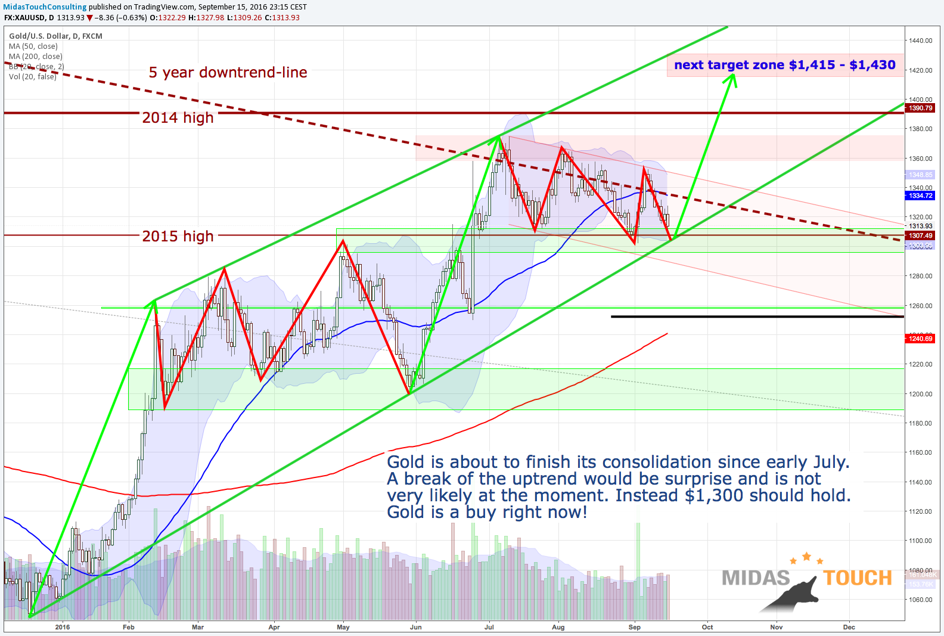
Since the Brexit panic gold has been stuck between $1,303 and 1,375. Using the spike in early February as a starting point gold is up just $50 in seven months! Not very convincing for a "young" bull or do we simply have to admit that this new bull is not an easy one to ride?! On the daily chart there are two fast and furious uplegs each one followed by a confusing multi-month consolidation pattern. Back in early June we went long at the last "real dip" below $1,210 and have been holding our positions until today. As examined on the monthly chart gold is in a bull run towards $1,500 - $1,530. That´s where we should expect a larger multi-month pullback... probably end of the year or spring 2017! Yet since early July gold has been moving into a complex compression triangle to consolidate the massive rally in June. Now it looks like it has been building a base and is ready for the next run up. I expect a significant move to the upside already next week because the uptrend-line should hold! I believe any short-term move below $1,315 is a chance to buy the dip and to add to your longs.
5. Bitcoin - consolidating but still bullish
(Click on image to enlarge)
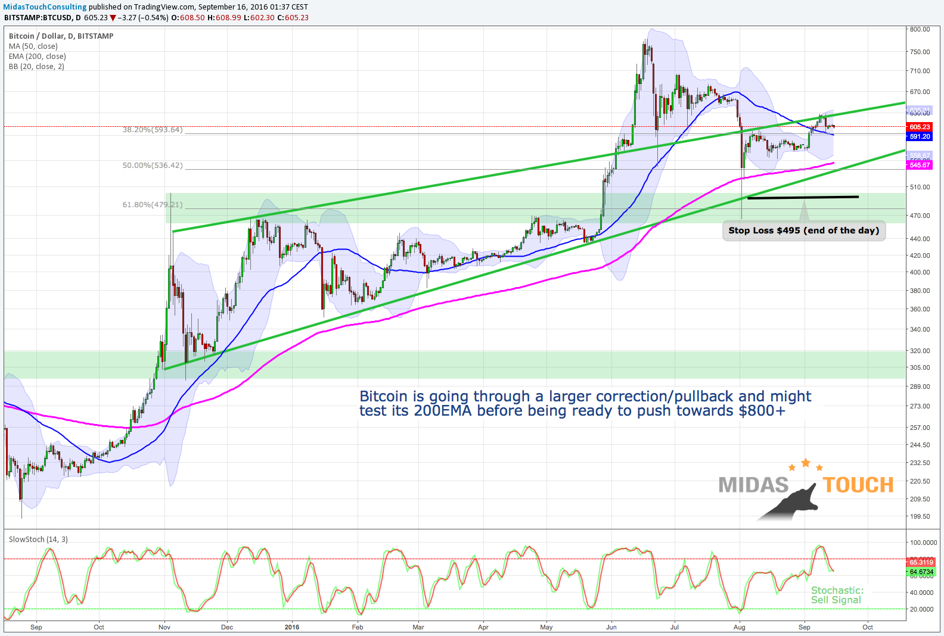
As already mentioned Bitcoin experienced quite some drama since my last report. I had warned about a Bollinger Band Squeeze and the coming correction. I was even talking about the worst case scenario and a pullback to the 200EMA (back then around $520).
After the shocking news the market dived to an intraday low at $465. But at the end of the day the price for one Bitcoin was already back up again at $535. Since then it obviously took quite some time to regain investors confidence but by now one could argue about the end of this correction. Overall the chart remains bullish and I guess its just a question of time until Bitcoin will test the recent high at $777. Just continue to hold your bitcoins.
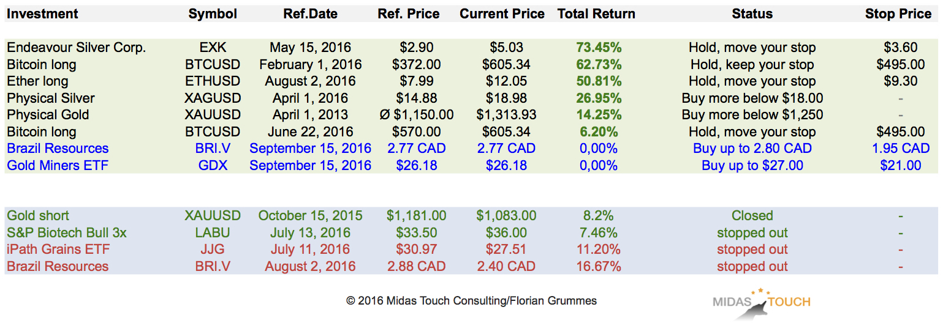
6. Midas Touch Consulting Portfolio & Watchlist:
Unfortunately we got stopped out in two positions but overall the portfolio is doing pretty well.
Endeavour Silver (EXK): Endeavour Silver is doing very well and remains one of the best silver stocks. Just continue to hold and let your winnings run.
Bitcoin (BITCOMP): Continue to hold, market is consolidating. Keep your end of the day stopp at $495.
Ether (ETHUSD): We had an awesome entry and are up already 50%. Continue to hold and move your stopp to $9,30.
Brazil Resources (BRI.V): We got stopped out at 2.40 CAD. The stock went even down to 2.00 CAD but has strongly recovered since then and is close to our former entry level. In retrospective the timing for the extensive special report was not perfect and the stop was too tight cause the stock remains a strong recommendation. If you´re still in just continue to hold. With its new acquisition the stock looks even better (now a 20 Mio. ounce player!). The management obviously continues to deliver. I therefore re-recommend the stock with a buy-limit up to 2.80 CAD.
Gold Miners ETF (GDX): Finally a larger pullback that we should use to enter this ETF. Buy up to $27. But there is still a chance that GDX might go down to its 200MA. Therefore place a stop far below current price level at $21.
S&P Biotech Bull 3x ETF (LABU): We got stopped out at 36.00 USD for a minor gain of 7.46%. I still like the Biotech sector a lot. We might get another entry chance during the typically weak September/October season....
iPath Grains ETF (JJG): We got stopped out at 27.50 USD for a minor loss. The sector has a lot of potential but is still captured in a strong downtrend.
(Click on image to enlarge)
7. Long-term personal believes (my bias)
Officially Gold is still in a bear market but the big picture has massively improved and the lows are very likely in. Gold was able to push above the Januar 2015 high at $1,307 and we finally looking at a series of higher highs. If this bear is over a new bull-market should push Gold towards $1,500 - $1,530 and Silver towards $26.00 within the next 8-24 months.
My long-term price target for the DowJones/Gold-Ratio remains around 1:1. and 10:1 for the Gold/Silver-Ratio. A possible long-term price target for Gold remains around US$5,000 to US$8,900 per ounce within the next 5-8 years (depending on how much money will be printed..).
Fundamentally, as soon as the current bear market is over, Gold should start the final 3rd phase of this long-term secular bull market. 1st stage saw the miners closing their hedge books, the 2nd stage continuously presented us news about institutions and central banks buying or repatriating gold. The coming 3rd and finally parabolic stage will end in the distribution to small inexperienced new traders & investors who will be subject to blind greed and frenzied panic.
Bitcoin could become the "new electronic money" for the digital 21st century. It is free market money but surely politicians and central bankers will thrive to regulate it soon.
If you would like to get regular updates on our gold model, gold and ...
more


Good write up. Agree on gold, disagree on virtual gold