
Gold Close To Its Downside Target
The decline in gold, silver and mining stocks continued yesterday, further increasing your profits on the current extra-large short position. But, since gold is already in the $1,260s, and our target area is $1,250 - $1,260, one should prepare for a nearby reversal.
Indeed, one should be prepared, but it doesn’t mean placing an exit order just yet. Apart from the price moving closer to our target of $1,250 - $1,260, we haven’t seen significant bullish confirmations that would invalidate the bearish case. Keeping in mind that the outlook for the medium term is very bearish, we don’t want to risk missing the big decline without a good reason. Gold moving close to its price and time target is still not enough. Mining stocks are showing some strength in general, as they didn’t move close to their previous 2018 low, even though gold is moving to new yearly lows almost on a daily basis, but, we haven’t seen the miners’ strength on a very short-term basis.
Based on the triangle-apex-based reversals that we discussed previously, it could have been the case that miners formed their bottom yesterday and today will be the reversal day for gold while miners show strength. If they do, we’ll have a bullish confirmation and we might adjust or even switch the position, but it’s too early to do so now.
Let’s take a look at the charts for details (charts courtesy of StockCharts).
Gold’s Decline and Downside Targets
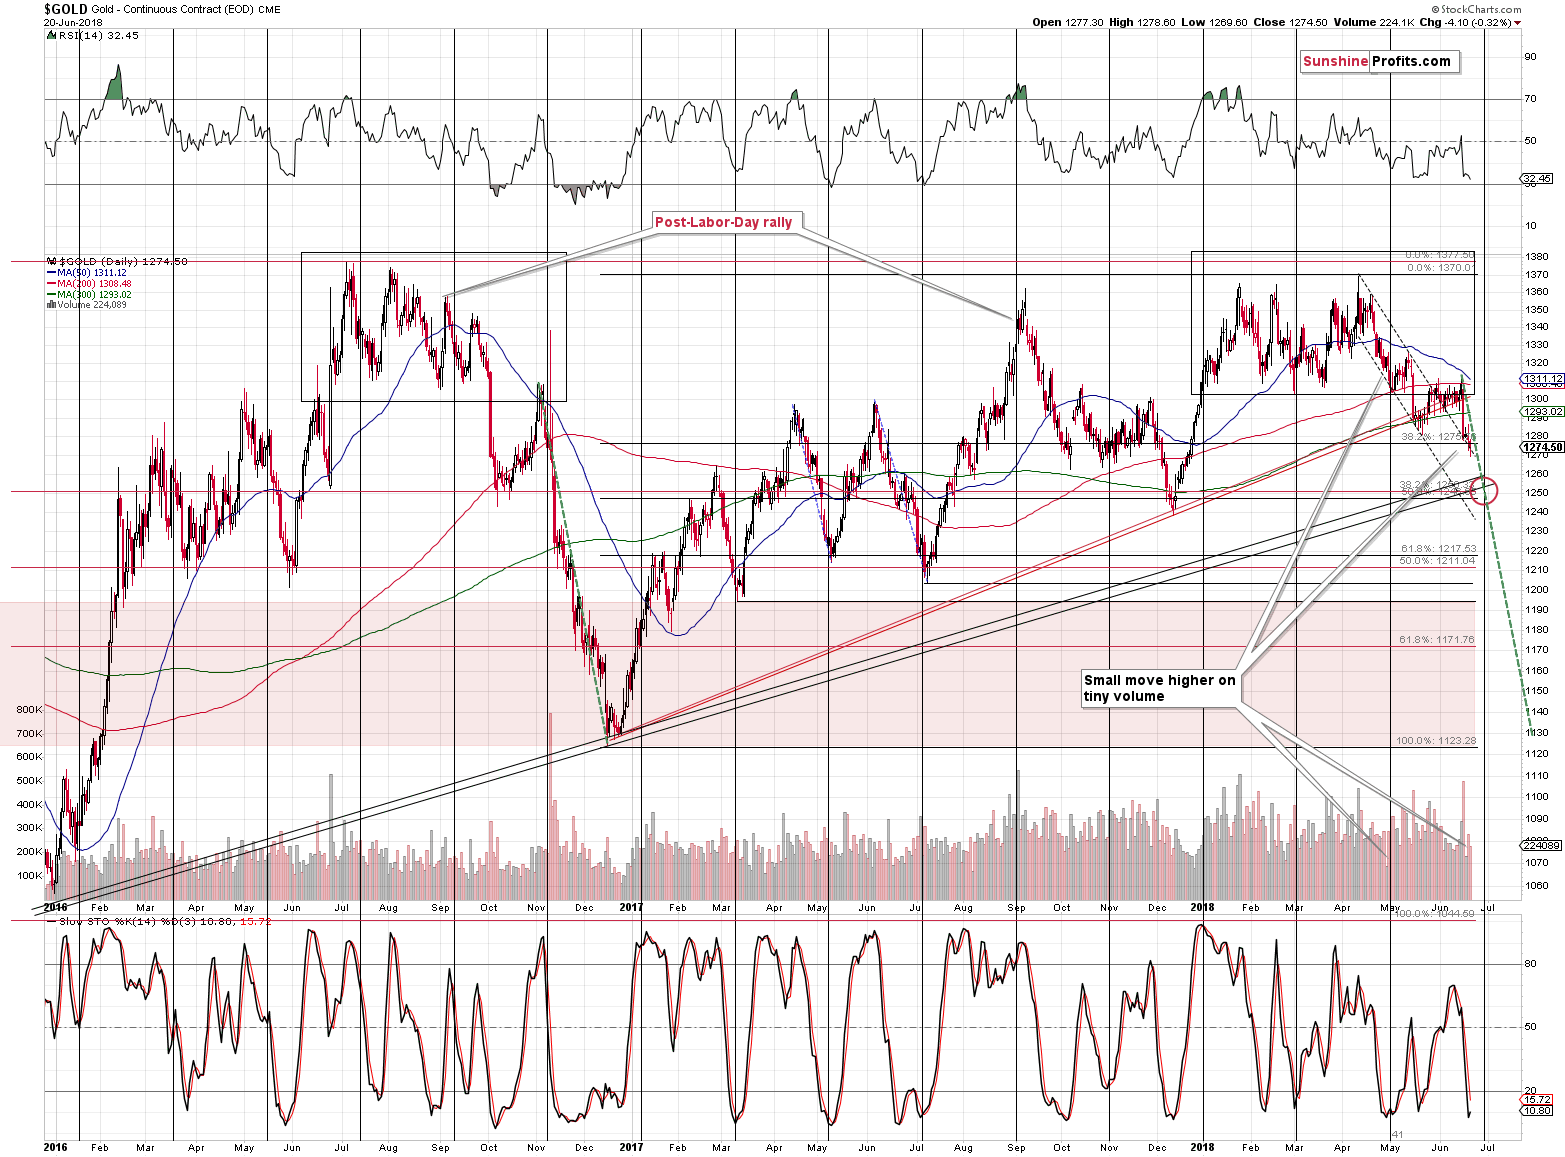
The decline in gold simply continues and the intraday chart shows that the decline is actually bigger than what you can see on the Stockcharts’ gold chart. Gold is now very close to the upper border of our target area and the odds of a corrective upswing have increased.
Again, just because the price targets are close, it doesn’t mean that it’s worth closing a short position – the corrective upswing could be small and/or very brief and trying to time it may do more harm than good.
Seeing a confirmation, however, could push the odds in favor of taking advantage of such a move.
The time is definitely right – today is the reversal day and the preceding move was definitely a decline, so the implications are clearly bullish. Still, based on the long- and medium-term signals, the decline is likely to be much bigger, so not missing it is more important than catching all the small, short-term upswings. Thus, we’re waiting to see a confirmation and we’re prepared for both: taking action and not taking action depending on what we see.
Silver’s Decline Continues
In yesterday’s alert, we wrote the following:
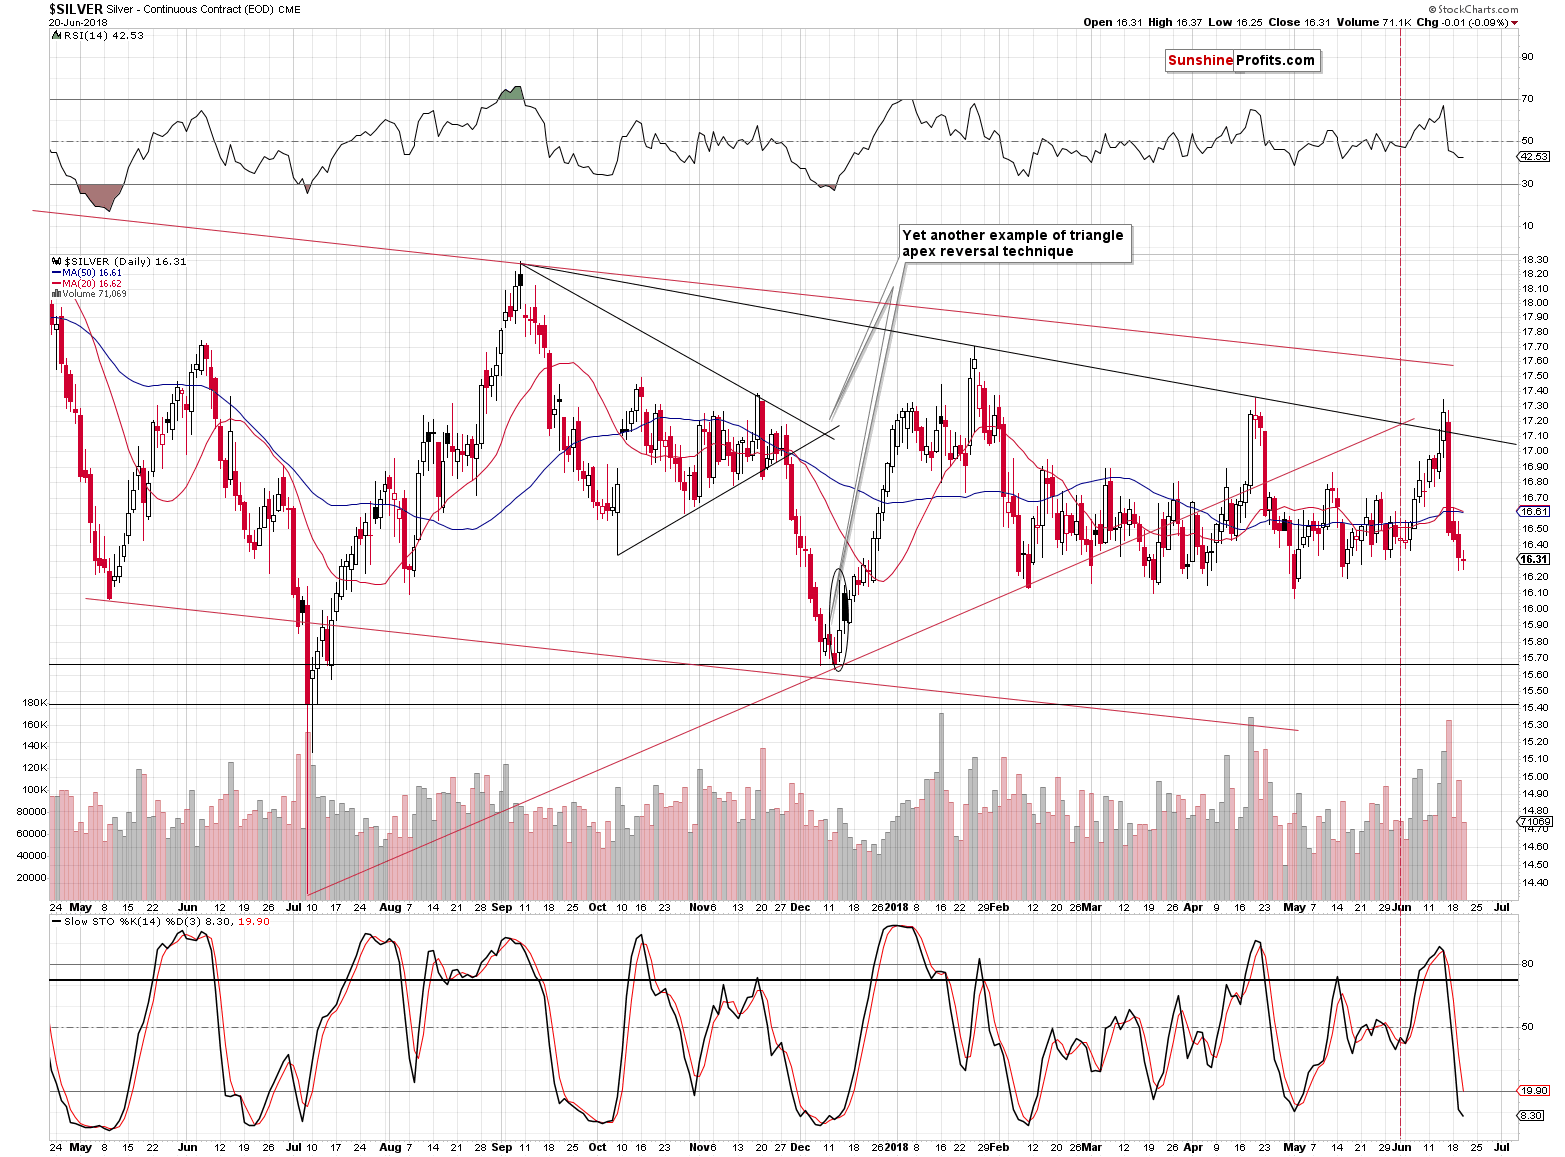
Silver moved lower on average volume, which is normal during a decline. The decline in volatility is a way of the market taking a breather, but unlike in case of gold, there was not enough strength among the silver bulls to prevent the daily decline.
Given the regularity in the recent bottoms, the silver bulls may be planning to take advantage of a move to $16.10 or so. That’s why we may see a temporary bounce from this level, but we don’t expect it to be anything major.
The above remains up-to-date, and we don’t have much to add to it today. Silver’s decline simply continues. At the moment of writing these words, silver is at $16.20, so it’s very close to the mentioned target. Just like it’s the case with gold, it seems that waiting for confirmations before taking action will be beneficial from the risk to reward point of view.
Follow-up to Gold Stocks’ Breakdown
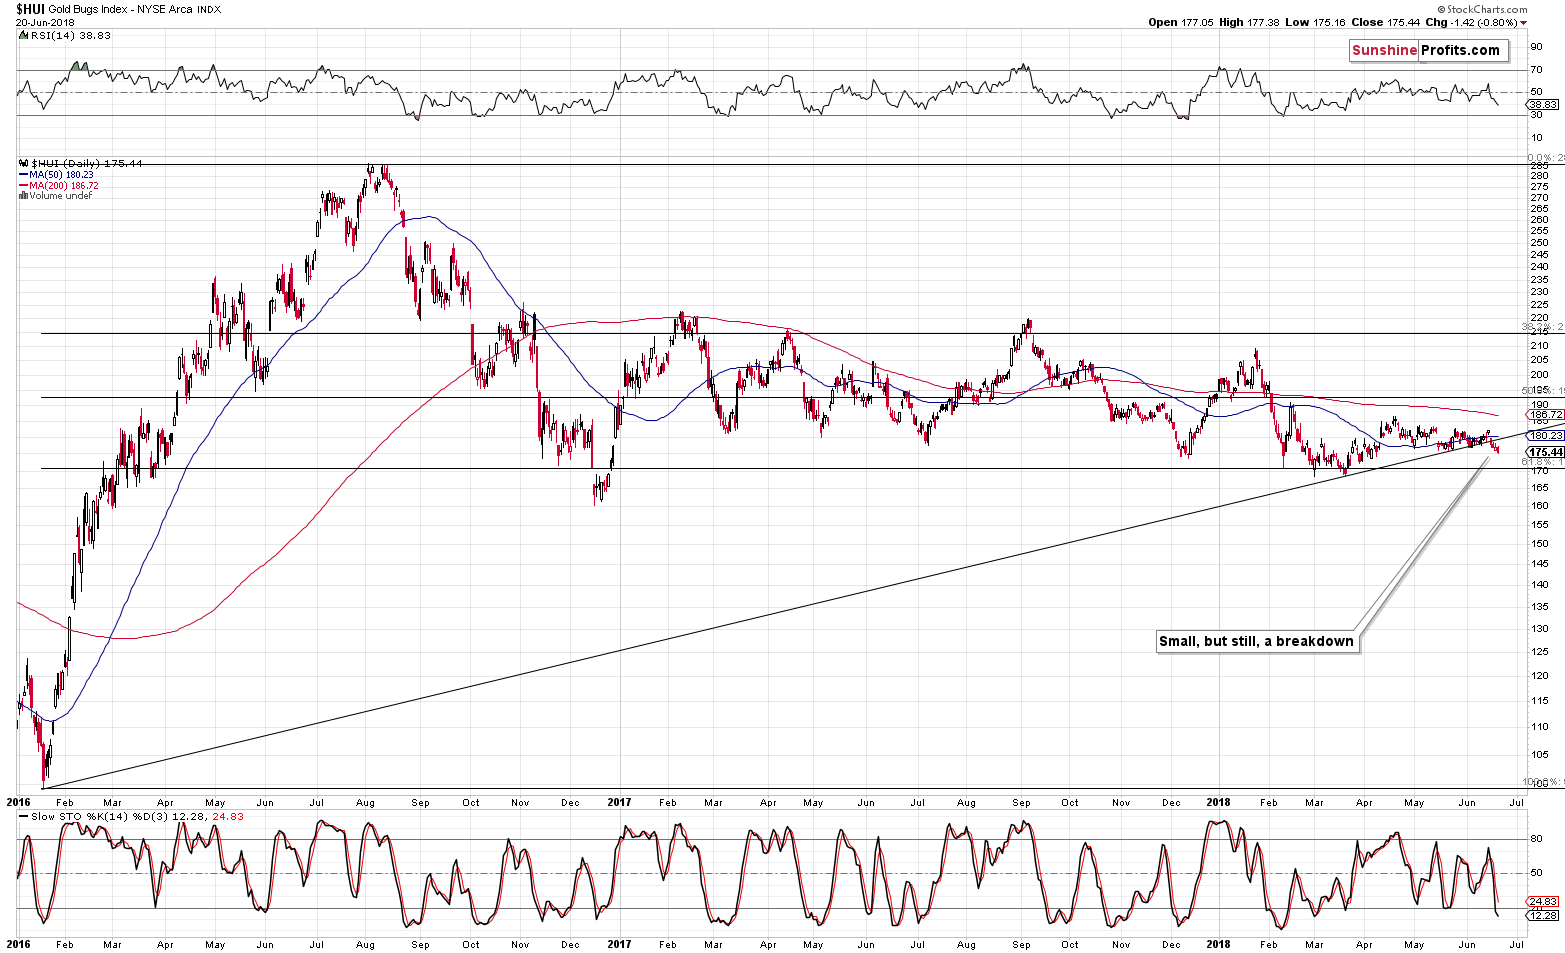
The key technical development of the week happened in gold stocks and it continues to have important implications for the following weeks. Naturally, we’re talking about the confirmed (!) breakdown below the rising medium-term support line in the HUI Index. The HUI closed below this line for 4 subsequent trading days, so the move is more than confirmed.
Still, at the same time, we have to note that gold miners are quite far from their 2018 lows, while gold is well below analogous levels. Strength and weakness in gold miners relative to the underlying metal often indicate price moves in the entire sector, so the above may seem like a bullish factor for the medium term. But is it?
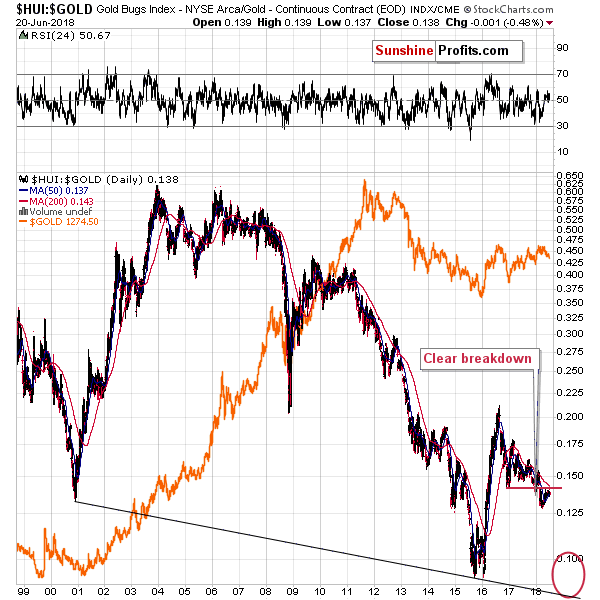
Not really. The HUI to gold ratio is after a major breakdown and it seems to have verified the breakdown by moving back to the previously broken level. That’s a textbook example of a verification of a breakdown. Consequently, while it may seem bullish on a day-to-day basis, it’s actually something normal from the medium-term point of view.
Having said that, let’s take a look at the forex chart.
USD Index’ Upside Target
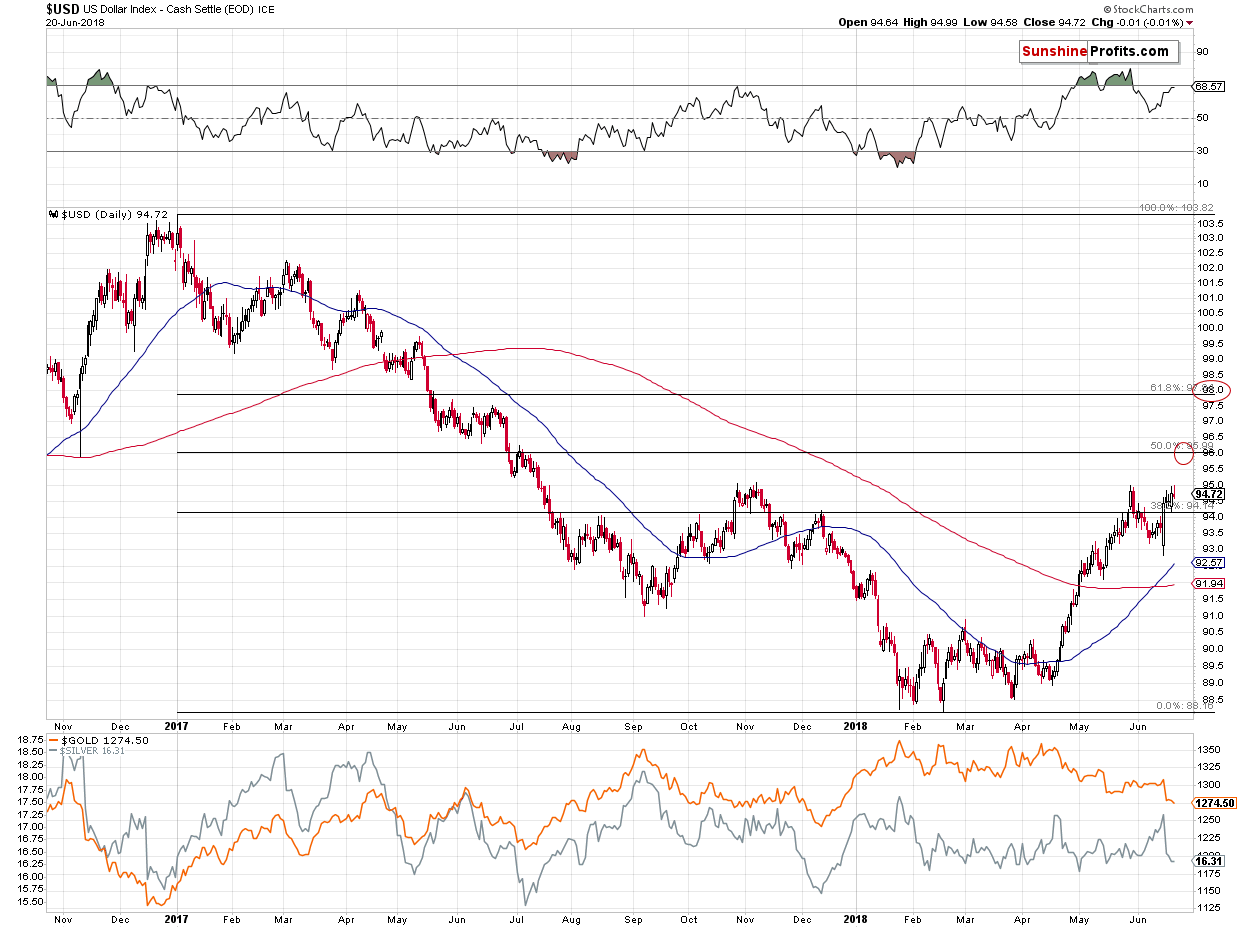
The above chart doesn’t feature any changes, but in the last several hours of trading, the USD Index moved to 95.49 (the USDX value at the moment of writing these words), which means that we saw a breakout above the May highs. What’s next? The next upside targets are provided by the 50% and 61.8% Fibonacci retracement levels based on the 2017 – 2018 decline.
This means that the USD Index is likely to rally to about 96 before taking the next breather. This level’s strength is additionally supported by the November 2016 low, which adds to its credibility.
Summary
Summing up, the decline in the precious metals market seems to continue and as gold and silver approach our target levels, it seems necessary to pay extra attention to what the market is doing, and then act accordingly. The medium-term outlook remains bearish, but the short-term outlook may become bullish shortly.
Disclaimer: All essays, research, and information found on the Website represent the analyses and opinions of Mr. Radomski and Sunshine Profits' associates only. As such, it may prove wrong ...
more

