
Gold Bulls Hope This Ratio Provides Best Message In 7 Years
Most investors are familiar with the relationship between the U.S. Dollar and Gold. Gold bulls like a weaker U.S. Dollar as it provides a tailwind for precious metals.
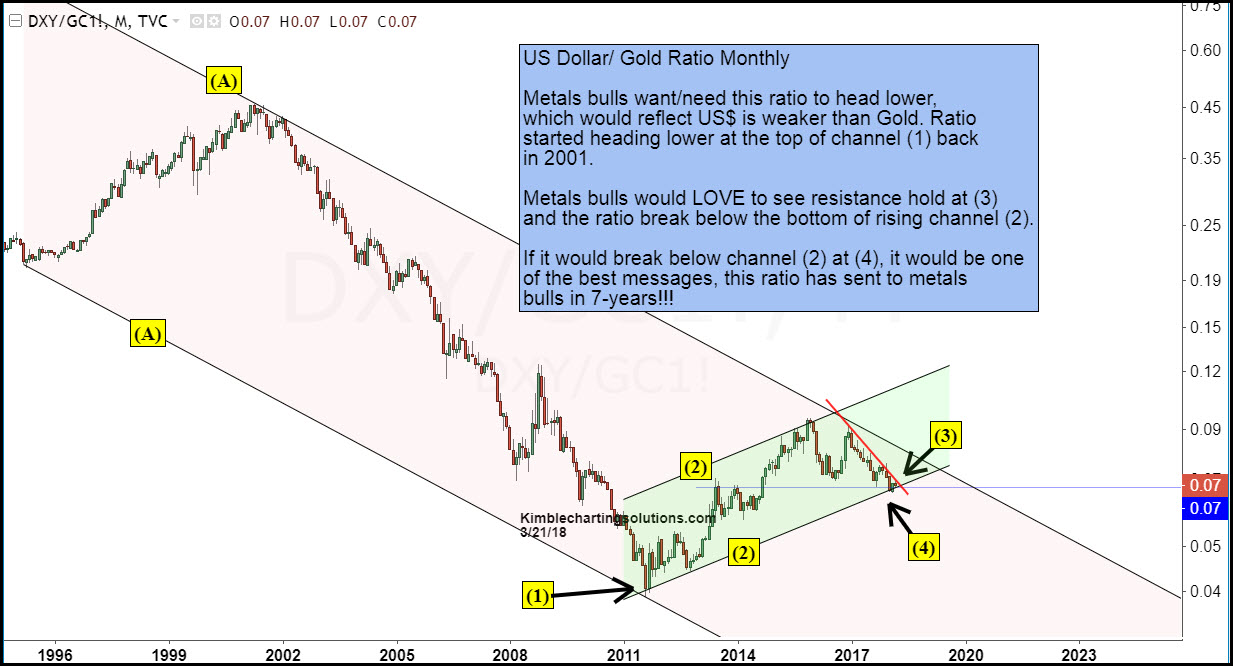
Here’s a prime example: Over the past 15 months, the US Dollar is down 14 percent. During that same time, Gold is up 17 percent. One way to illustrate this is to track the ratio of the US Dollar/Gold – see the chart below. It uses monthly bars and dates all the way back to 1995.
Bulls like a weaker dollar, so they want/need this ratio to be heading lower. The ratio began heading lower in 2001, and a weaker dollar provided fuel for the Gold bull market, allowing the ratio to drop to a low in 2011 (as Gold made all-time highs).
Since 2011, the ratio has moved higher, forming a rising channel (2) within the broader downtrend channel (A). This had Gold bulls under pressure until 2017 when the Dollar began to underperform Gold at a steady clip.
But that’s come to a head.The ratio is being squeezed by the red short-term downtrend line (3) and its uptrend line (4).
Remember, Gold bulls want this ratio heading lower. So if it breaks below support at (4), it would be one of the best messages the ratio has sent to metals bulls in 7-years.
On the flip side, a break higher would keep Gold at bay. So it’s wise to put this on your radar.
U.S. Dollar Index / Gold Ratio (monthly bar chart)
(Click on image to enlarge)
Sign up for Chris's Kimble Charting Solutions' email alerts--click here.


