
Gold & Silver Trading Alert: New Important Technical Development
During yesterday’s session, the USD Index plunged once again and so did the general stock market, while gold rallied over $20 and we see a new major technical development that we’ve been expecting to see for some time now. What’s new and what changed?
Let’s start with gold (charts courtesy of http://stockcharts.com and http://sunshineprofits.com).
(Click on image to enlarge)
In yesterday’s intra-day alert, we wrote the following:
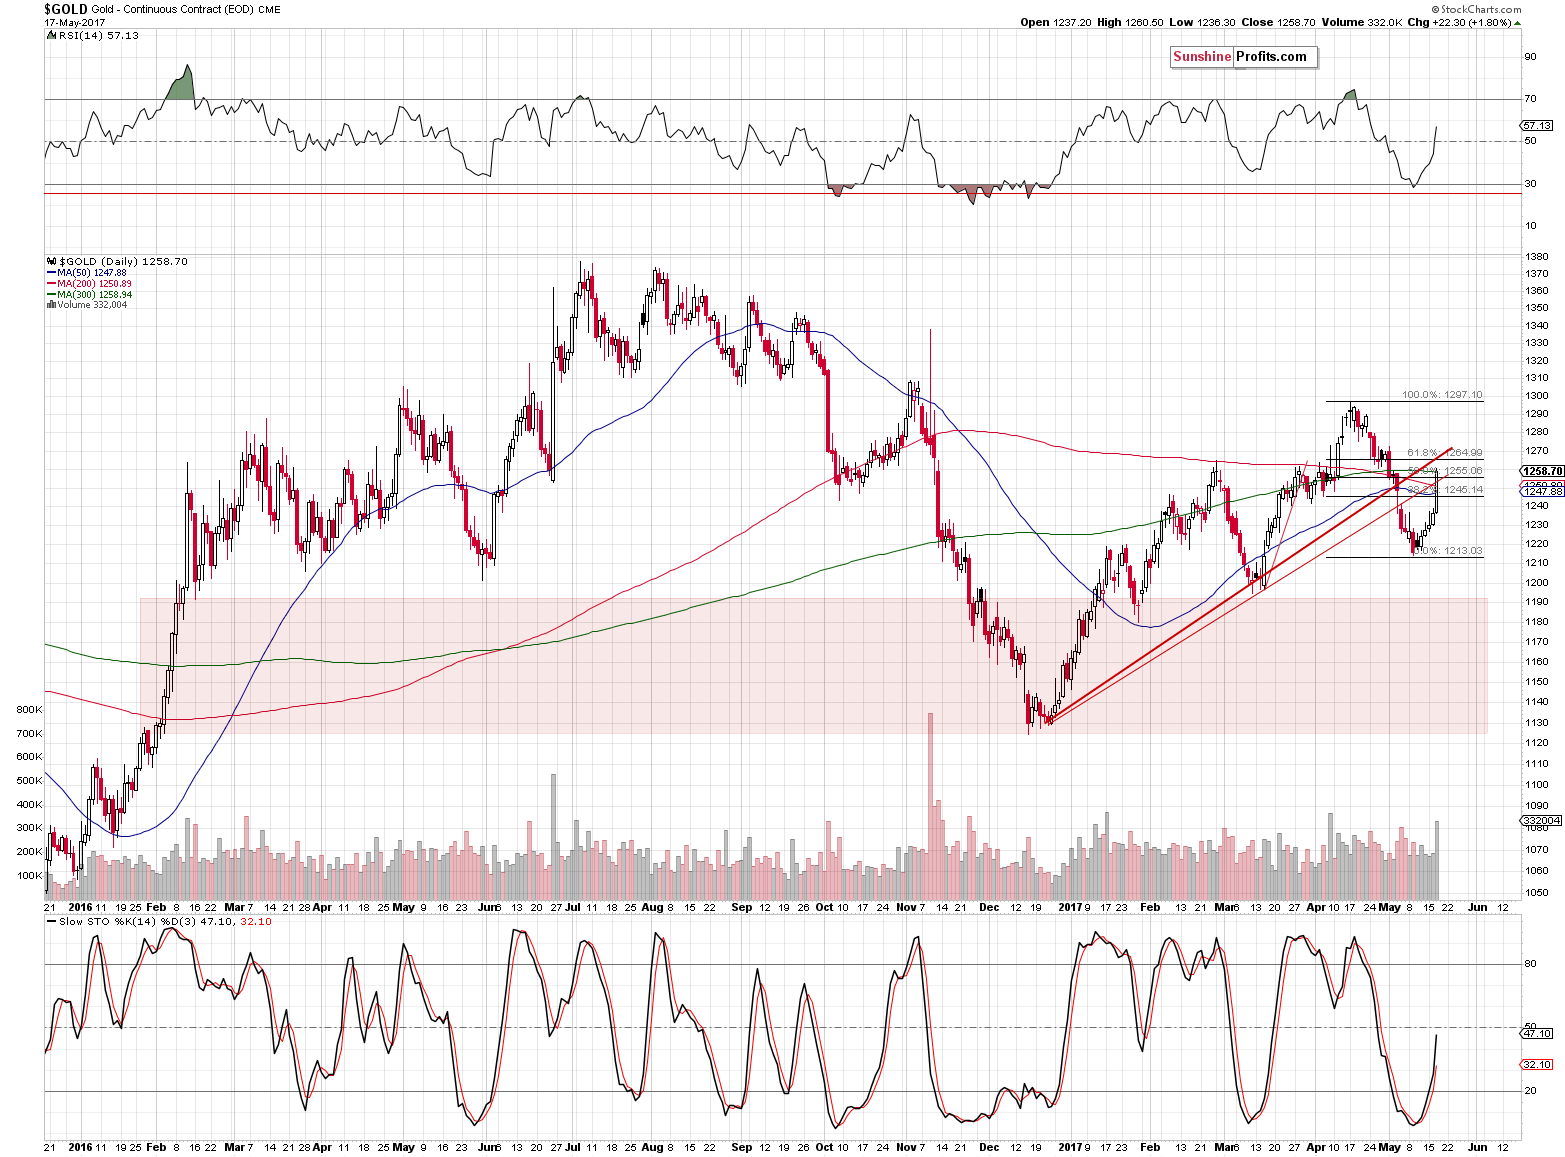
So, nothing really changed in silver and miners. It does appear to have changed in gold, but… Only until one actually looks at the gold chart. Gold was the only part of the precious metals market that didn’t move to some kind of strong resistance - until today. On the gold chart that we featured in today’s alert (as well as in the previous ones) you can see a rising red support line based on the December 2016 and March 2017 bottoms. This line was broken in early May and it has never been verified as resistance again, until today. Gold moved practically right to it and stopped. Is the rally over? Now, that gold, silver and mining stocks reached their strong resistance levels it’s certainly likely that this is the case or that it will be the case shortly.
We updated the mentioned rising red resistance line by drawing 2 lines instead – one based on the intra-day lows and the other based on the daily closing prices. Gold moved and closed a little above the lower of the lines (the less significant one; based on the intra-day bottoms) and didn’t break the upper one based on the daily closing prices.
All in all, yesterday’s rally is not a true breakout, but rather a verification of a breakdown.
(Click on image to enlarge)
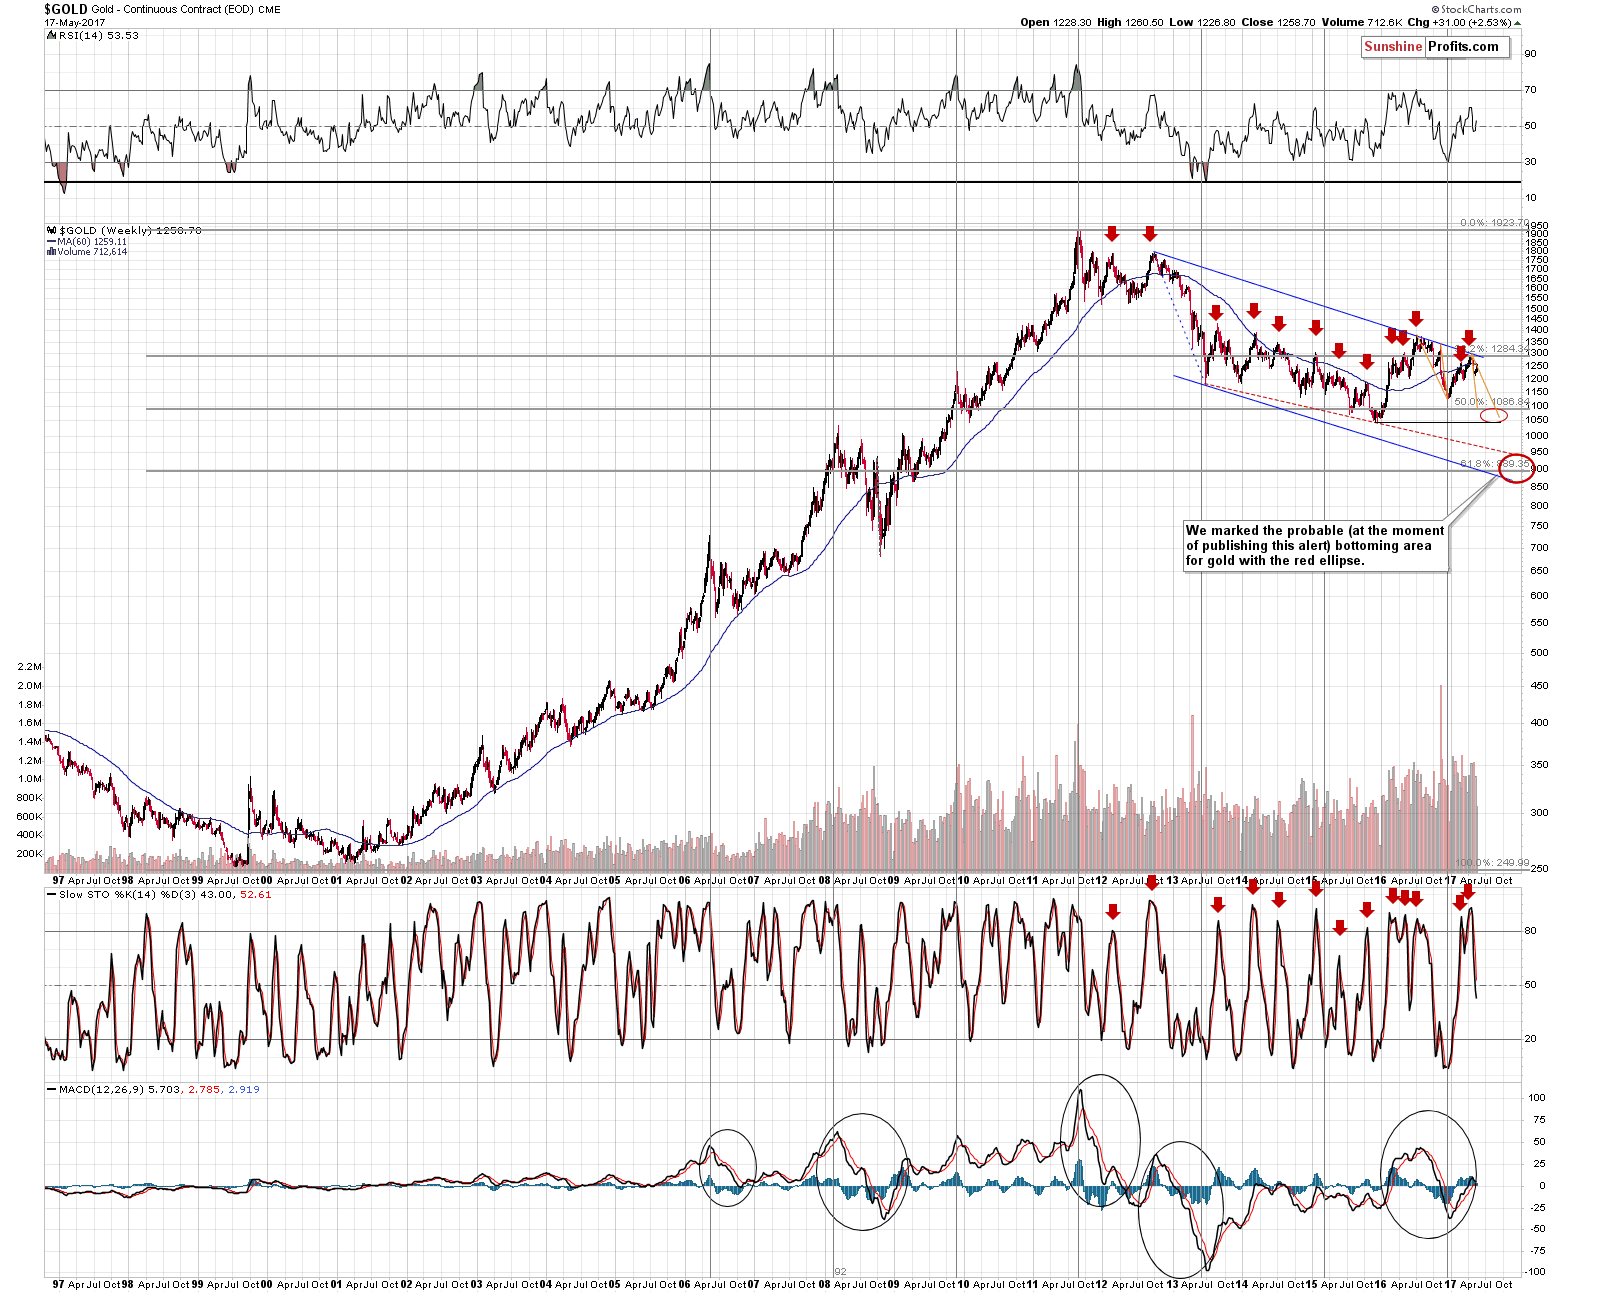
The above long-term chart helps to put things into proper perspective.
First of all, gold’s upswing remains in tune with the late-2016 decline. Please note that the orange lines represent the pace of the decline based on 2 important tops – each analogy is important and as long as gold remains between these lines or deviates from them in just a minor way, then the 2 declines will remain similar. Based on this analogy gold is likely to move close to its 2015 lows sometime this summer.
Secondly, please note that gold is not only verifying the breakdown below the rising support line (as seen on the previous chart), but also below the 60-week moving average. There was no big move above it (gold remains below it at the moment of writing these words), so the proximity of such an important resistance is a bearish factor.
(Click on image to enlarge)
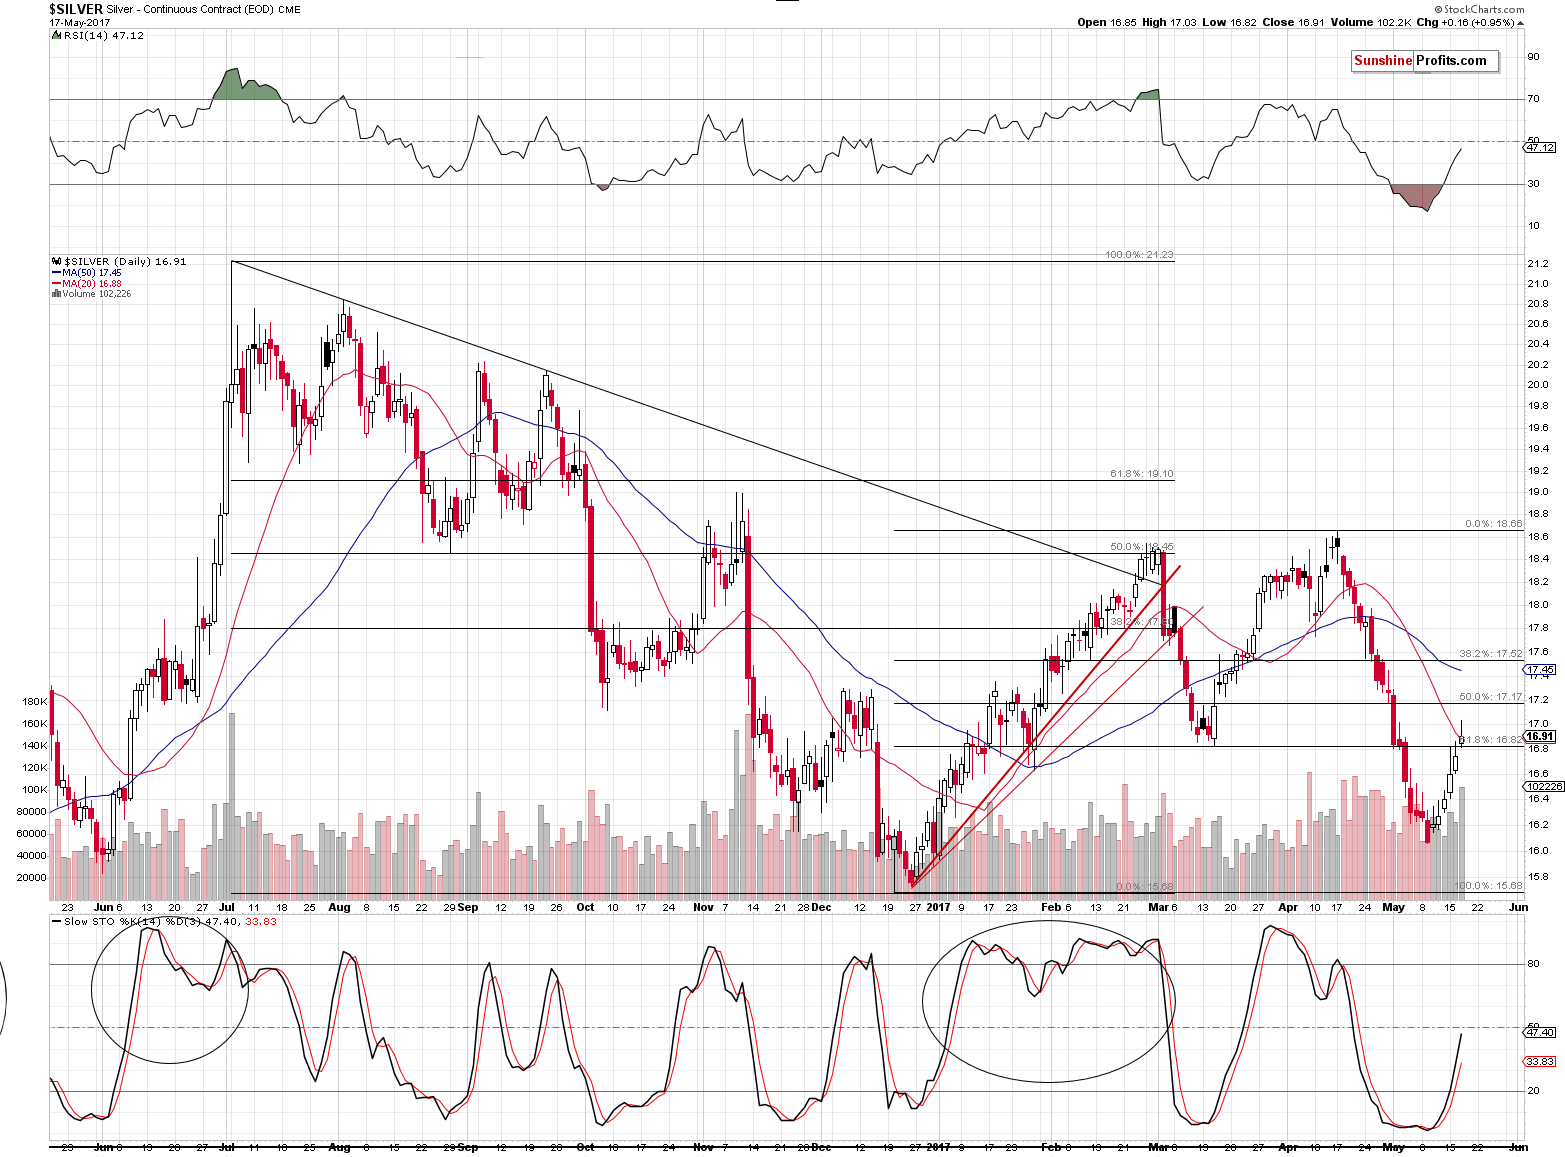
In yesterday’s alert, we wrote that silver remained below the resistance levels: the March lows and the 61.8% Fibonacci retracement level, so technically nothing had changed based on the previous day’s price change. Silver moved above the March lows and the 61.8% Fibonacci retracement only insignificantly and at the moment of writing these words it’s already back below the mentioned levels (at $16.77), so the tiny breakout is already invalidated. Again, nothing really changed technically and the outlook remains bearish.
To be precise, something was indeed seen in the silver market – a daily reversal on significant volume, which is not a bullish factor, but a bearish one.
(Click on image to enlarge)
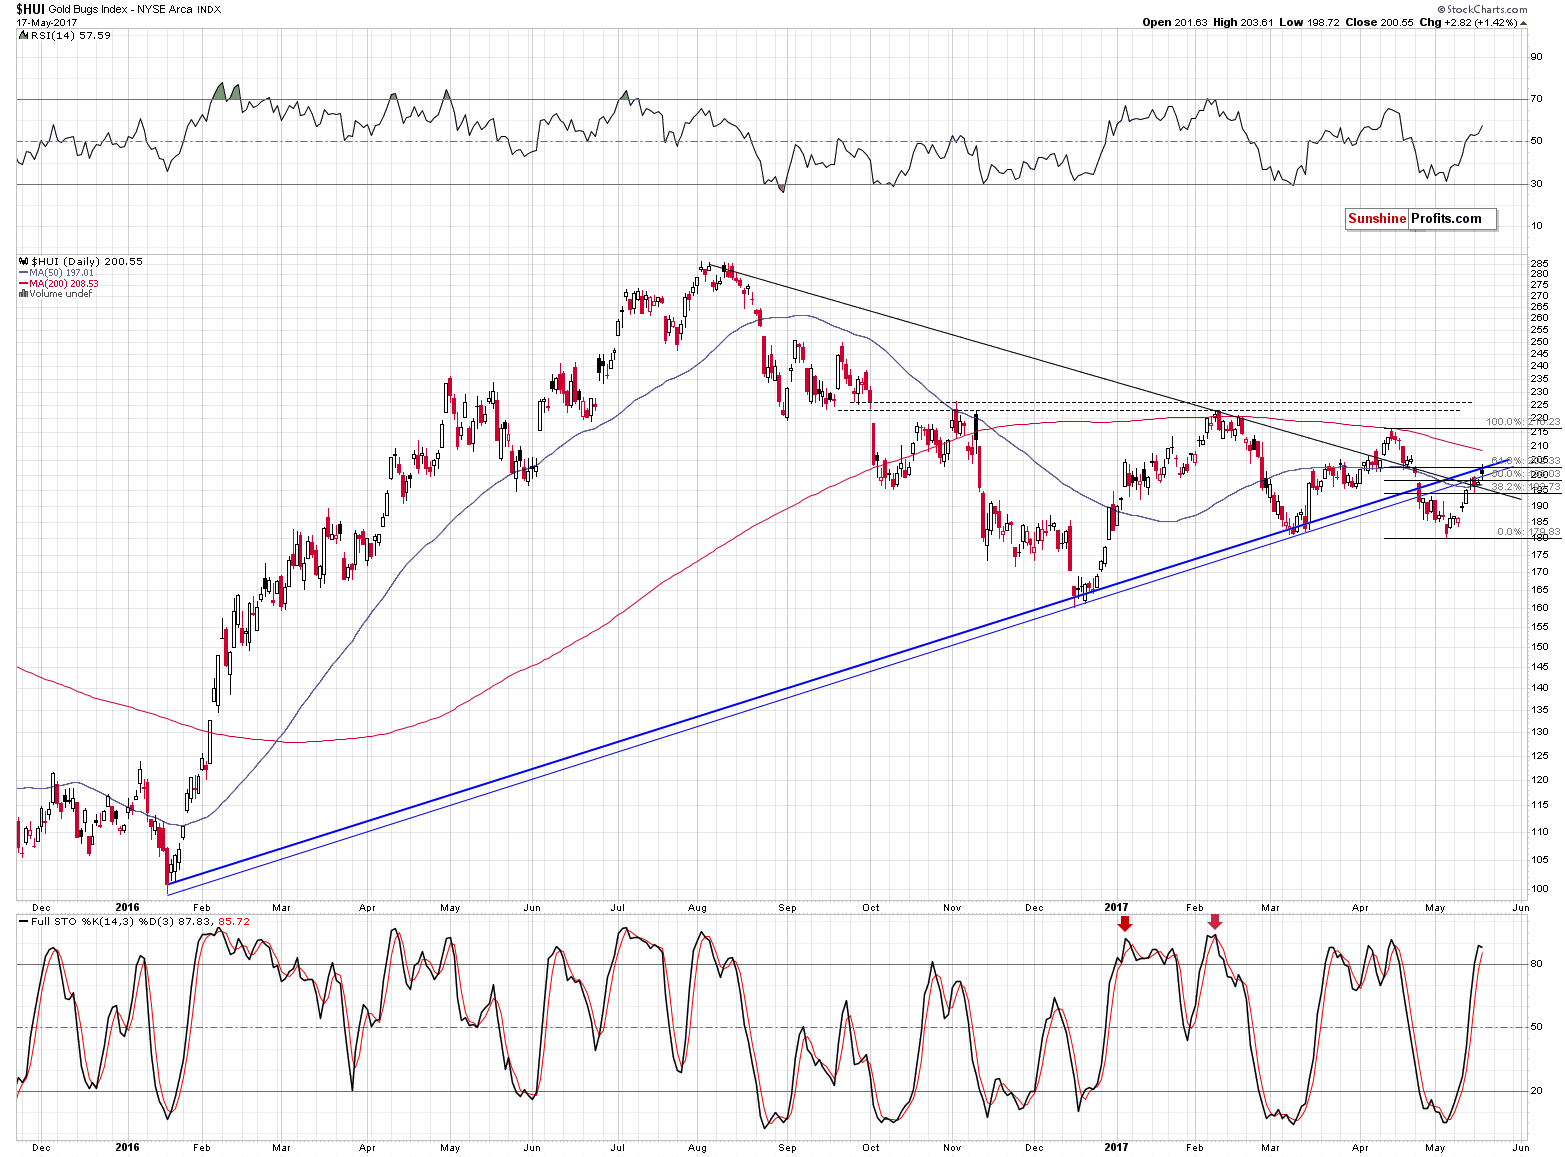
The same goes for mining stocks. The HUI Index didn’t invalidate the breakdown below the key (upper one, based on the daily closing prices) rising blue resistance line – even though the USD Index declined so significantly and gold rallied $20, and thus the outlook didn’t become more bullish than it had been previously – if any change is to be discussed, then it would be an increase in the bearishness due to the miners’ lack of reaction to the USD’s daily slide.
The interesting thing to watch yesterday was the intra-day performance of gold stocks compared to the price of gold. Mining stocks moved higher along with gold (not rallying as significantly, but still), but when gold gave away only a part of its gains miners reacted by declining more significantly. As gold moved higher – and above the previous intra-day high – miners also moved higher, but not above the previous intra-day high. This action took place a few times and it shows how reluctant mining stocks are to react to positive developments in the gold market.
All in all, even though a lot seems to have happened, quite little changed. So… Why did we title today’s analysis “New Important Technical Development”?
(Click on image to enlarge)
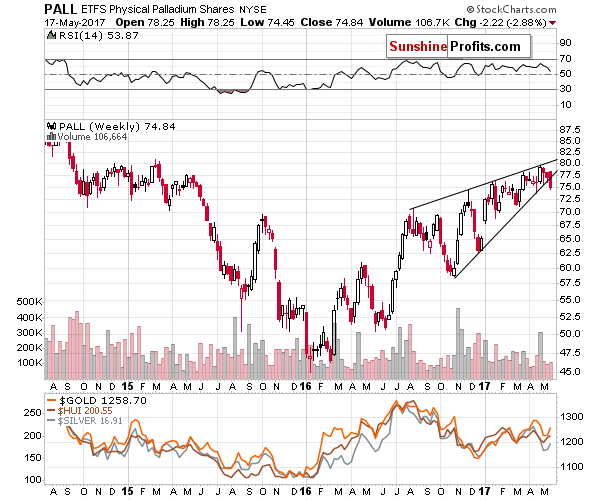
Palladium finally broke below its rising wedge pattern. This breakdown will be confirmed once we see the weekly close below it, but the move is already important as we haven’t seen anything like that so far this year. Big moves in palladium and big moves in the rest of the precious metals sector tend to take place simultaneously and the breakdown below the big wedge pattern (based on almost a year of price moves) is definitely likely to trigger a major decline. Consequently, the implications for the entire precious metals sector are bearish.
Summing up, the outlook for the precious metals market remains bearish and the very weak reaction to the USD’s daily slide serves as a bearish sign even though the latter may appear as something bullish for PMs. Silver’s reversal on big volume and major (unconfirmed, but still) breakdown in the price of palladium serve as additional bearish confirmations.
Disclaimer:
All essays, research and information found on the Website represent the analyses and opinions of Mr. Radomski and Sunshine Profits' associates only. As such, it may prove ...
more

