Global Fixed Income: The 2016 Final Grades Are In
There is no doubt that 2016 proved to be rather volatile in the global fixed income arena. There certainly were many factors, headlines and events (plunging oil prices, Brexit, the U.S. presidential election, the Federal Reserve’s (Fed) second rate hike, etc.) the collective bond market had to contend with, which most assuredly were integral for this roller-coaster ride.
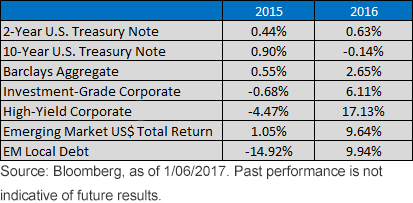
If we cut through all the noise, a recurring theme seemed to be that, in terms of overall performance, 2015’s losers became 2016’s winners. Nowhere was this trend more evident than in the U.S. corporate bond market, as one of the worst-performing fixed income asset classes of 2015—high yield (HY)—became the top performer last year. As measured by the Barclays U.S. Corporate High Yield Total Return Index Unhedged, HY produced a reading of +17.13% in 2016, more than reversing the prior year’s 4.47% decline. It should be noted that it didn’t start out that way, as the HY sector was certainly going through its struggles to begin 2016. Indeed, the plunge in oil prices and the increased anxieties it produced regarding elevated default rates pushed HY spreads out to levels we hadn’t seen in almost five years. As energy prices reversed course and the market’s worst fears weren’t realized as a result, investors viewed HY corporates as a rather attractive investment vehicle, with spreads finishing last year 430 basis points (bps) below their peak reading of early February. In the investment-grade (IG) corporate market, a similar pattern emerged. According to the Barclays U.S. Aggregate Corporate Total Return Value Unhedged Index, the IG sector finished 2016 with a positive performance of +6.11%, a rather noticeable improvement from the prior year’s -0.68% reading.
Total Returns
For definitions of indexes in the chart, visit our glossary.
The emerging market (EM) debt experience had the most noticeable reversal of fortunes, specifically in the local debt area. To be sure, EM local debt produced a total return just under +10% (J.P. Morgan Government Bond Index – Emerging Markets Global Diversified Index) last year, which represented a turnaround of nearly 25 points from the 2015 shortfall of -14.92%.
From the interest-sensitive side, U.S. Treasury market (UST) performance numbers varied depending upon where one sat on the yield curve. To illustrate, the UST 2- Year return came in on the plus side of the ledger, at +0.63%, compared to a negative showing of -0.14% for the UST 10-Year (utilizing the Citi 2-Year and 10-Year Treasury Benchmark On-the-Run Index). With respect to the UST 10-Year, this was a perfect example of the roller-coaster ride discussed earlier, as its total return in the days and weeks post-Brexit was solidly in the plus column, hovering around +8.0%.
Conclusion
So where are we headed in 2017? Given the different starting points between this year and 2016, it would not seem reasonable to expect duplicate performances from the HY, IG and EM local debt asset classes this year. However, that does not mean positive performances won’t ultimately be realized, it’s just that the magnitudes would more than likely be lower. Certainly, there are a lot of unknowns entering the equation as well (the new Trump administration, potential fiscal stimulus, eurozone elections and Fed policy, to name a few). So fasten your seat belt and get ready for another potentially volatile ride in fixed income land in 2017.
Disclaimer: There are risks involved with investing, including possible loss of principal. Foreign investing involves currency, political and economic risk. Funds focusing on a single country, sector ...
more


