
Global Asset Allocation Update - Tuesday, Jan. 10
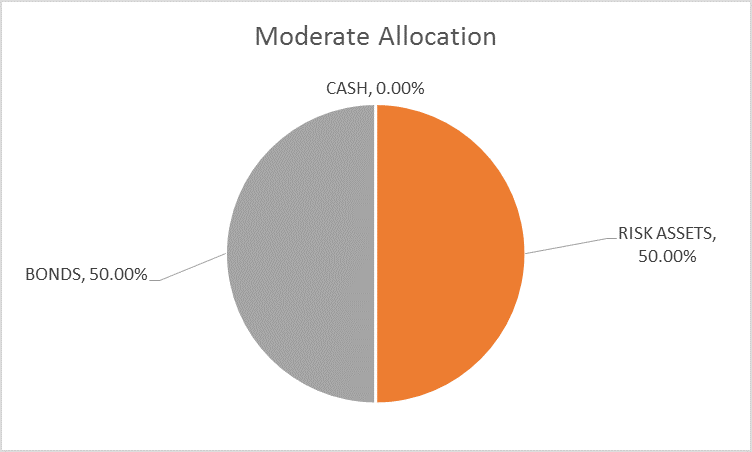
Market based expectations for growth and inflation have moderated slightly since the last update. Since mid-December, interest rates – nominal and real – have fallen back, the yield curve has flattened, the dollar index has pulled back from its highs and gold has moved off its lows. In short, the Trump trade is being partially reversed as it dawns on investors that change will not be easy and probably not that quick either. After our minor allocation change last month to eliminate our cash position, there are no changes to the risk budget this month. For the moderate risk investor, the allocation between risk assets and bonds is unchanged at 50/50. There are some other changes to the portfolio that moves the allocation a little more toward a pro-growth stance.
(Click on image to enlarge)
As I said last month, the changes in growth and inflation expectations after the election, as expressed in the bond markets, were fairly small. Stock investors were obviously more optimistic – downright giddy for a while – but the rally has stalled recently as markets reassess, as the reality of change nears. This is all just part of the normal market process of incorporating new information into prices as it becomes available. The process is normally fairly smooth, bonds, stocks and commodities shifting slowly as perceptions of the economy shift. But when big changes are afoot, the market process can get messy as it has since the election. The market tries its best to price in the coming policy changes but has to adjust more frequently as what is proposed and favored by the market butts up against what can actually be accomplished. I would expect to see more “adjustments” – volatility – in the coming months as the new administration tries to implement its agenda.
Indicator Review
- Credit spreads – Spreads were one of the few areas that continued to improve since the last update. The spread between junk bond yields and Treasury yields is rapidly approaching the low for this cycle set in the summer of 2014. The recovery in oil prices has obviously been a boon to energy bond holders. There is no stress in the junk bond market presently but spreads are quite narrow and it wouldn’t take much of a negative surprise to increase spreads. For now, though, in the midst of a mild growth rate upturn, that seems unlikely.
(Click on image to enlarge)

- Yield Curve – The yield curve continued to steepen after the last update but has since turned to flattening again and is now 11 basis points flatter than it was at the beginning of December. The flattening was entirely due to a drop in long term rates as the 2 year actually rose a couple of basis points. The change in long term rates reflects a slight reduction in both growth and inflation expectations. The yield curve at present is in the middle of its historic range, nowhere near the flat or inverted posture normally seen prior to recession.
(Click on image to enlarge)

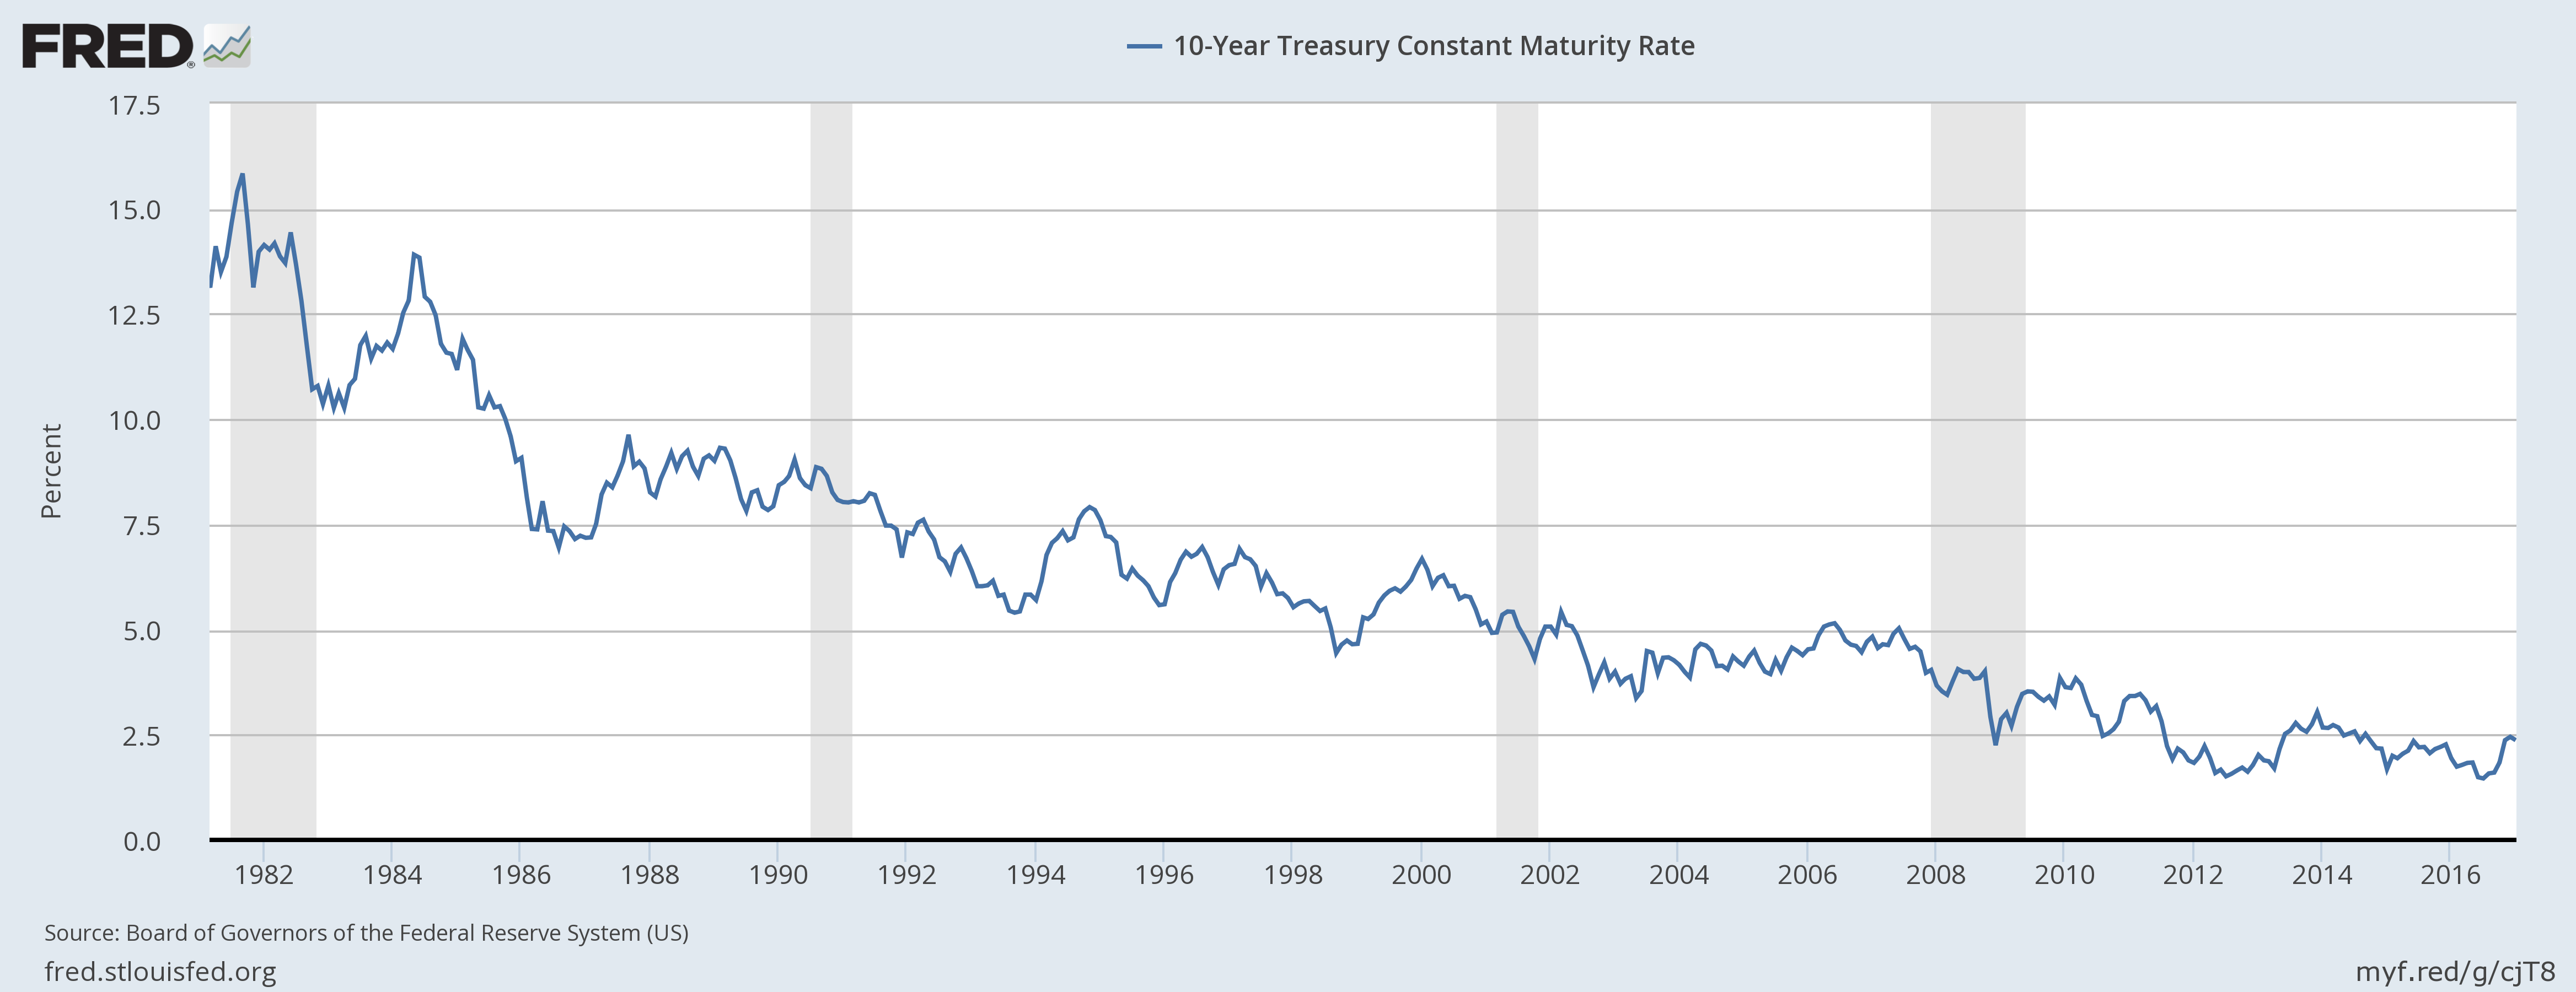
Are bond yields ready to rise? Is the long bond bull market over? Bull markets aren’t known for ending with everyone bearish so I have my doubts. It may be that we are in the trough now but even if we are, history – and common sense – says we’ll be here for a while. The 10 year Treasury yield dipped some since the last update, a reduction in nominal growth expectations.
(Click on image to enlarge)
Real growth expectations, as seen through real yields, have been remarkably stable – and low – since mid-2013. The election of Donald Trump did not move us out of the range. 5 year TIPS yields are about to turn negative again.
(Click on image to enlarge)

- Valuations – Nothing has changed on this front. The US stock market is expensive and earnings growth is, at present, too subdued to change that significantly. Most foreign markets are cheaper than the US and economic growth appears to be turning up. Emerging markets are cheapest while developed markets are slightly less so. Europe is generally cheap with country specific exceptions and recent economic stats have been beating expectations, although a lot of that has been sentiment based (PMIs). Some Asian markets are cheap – Singapore and Australia for instance – but China casts a long shadow. From a valuation standpoint, an investor has to favor international over US but that isn’t the only consideration. The course of the dollar has a big impact on ex-US returns and it has been strong of late. I suspect though that the strong dollar – another very consensus position – will fall victim to the Trump administration’s trade policies. That would actually be a pretty good outcome compared to a trade war with tariffs.
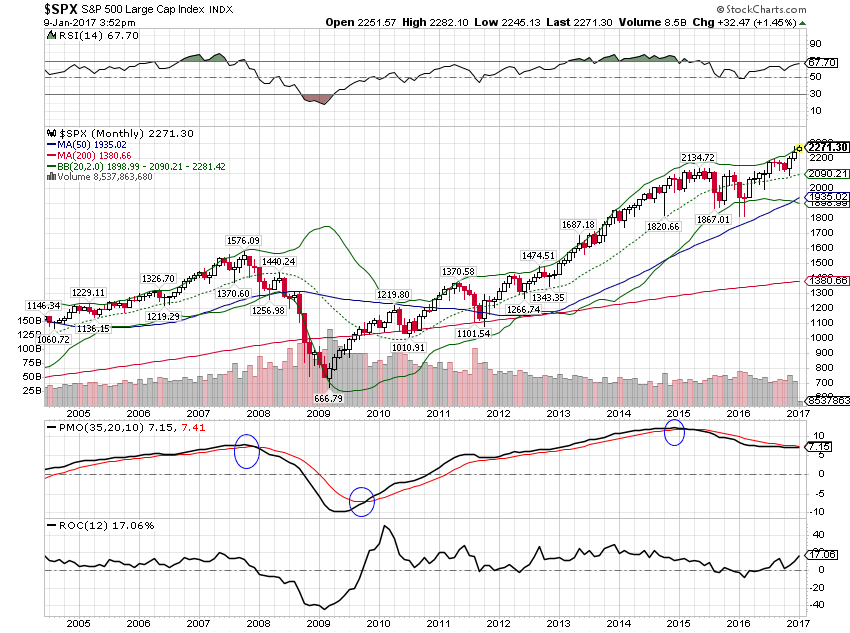
- Momentum – Despite nominal new highs the long term momentum picture for the S&P 500 has not changed. It would not take much of a rally in January to change that though. Daily momentum has turned negative now but weekly remains positive.
(Click on image to enlarge)
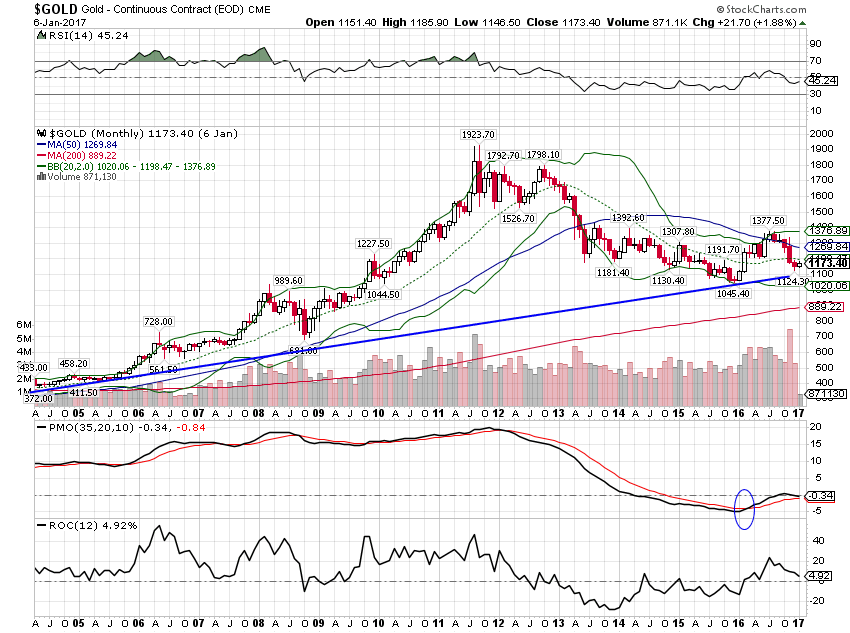
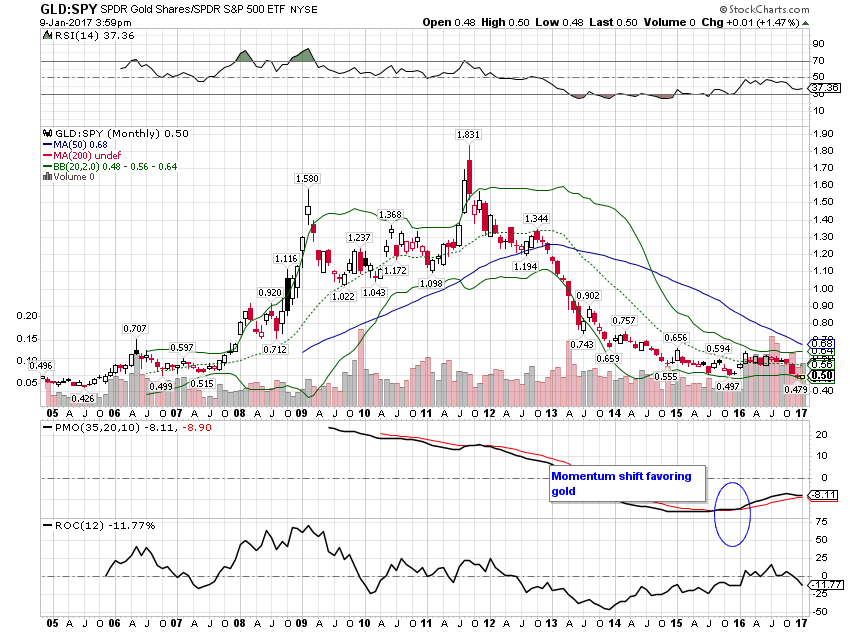
Gold appears to have completed its correction with long term momentum intact and bullish.
(Click on image to enlarge)
The long term momentum shift favoring gold over the S&P 500 is also intact having tested the lows successfully so far.
(Click on image to enlarge)
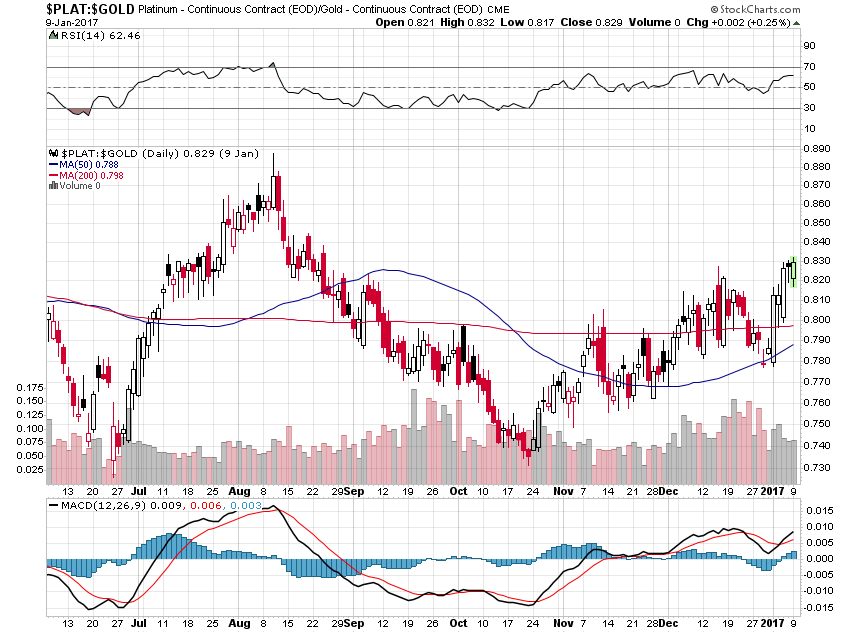
With the better growth expectations since the election though, another metal – platinum – is now outperforming gold.
(Click on image to enlarge)
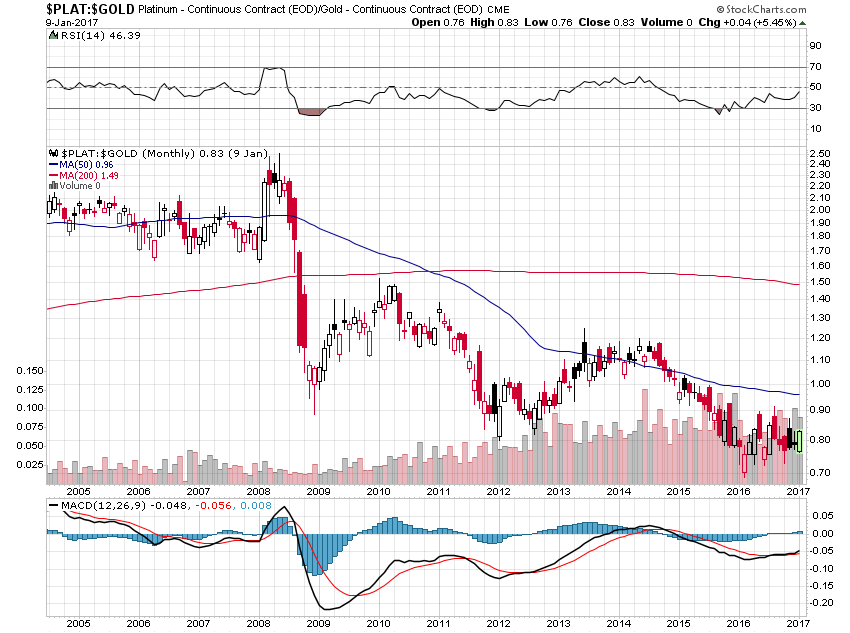
Not only that but platinum is very cheap relative to gold. Platinum trading for less than gold is the exception rather than the rule. The current ratio has platinum the cheapest relative to gold since the early 80s. Monthly momentum of platinum versus gold has turned positive. I will replace part of our gold holdings this month with platinum in the form of the Physical Platinum ETF (PPLT). Platinum tends to outperform gold when growth is better so this is just another indication that growth expectations are rising.
(Click on image to enlarge)
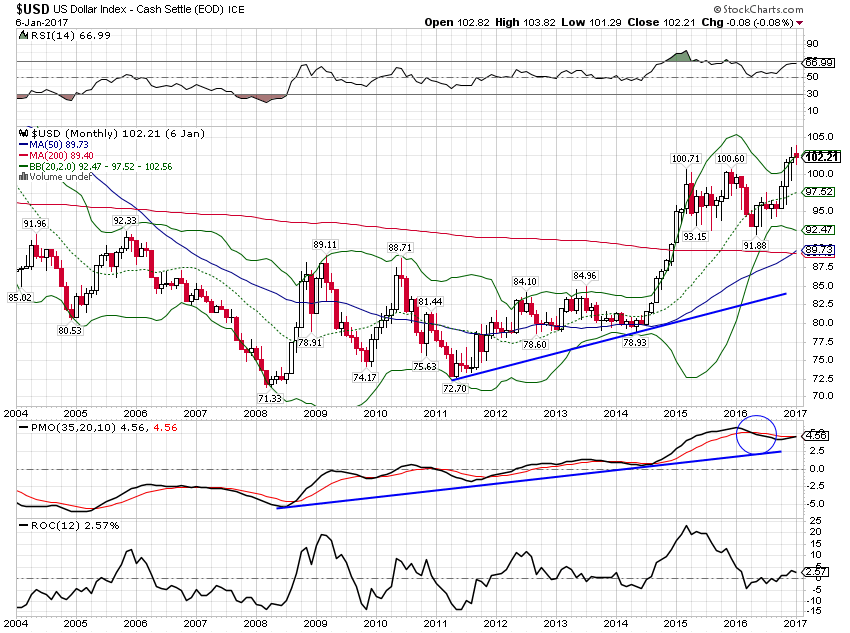
And despite new highs for the dollar index, long term momentum is still pointing to lower levels.
(Click on image to enlarge)
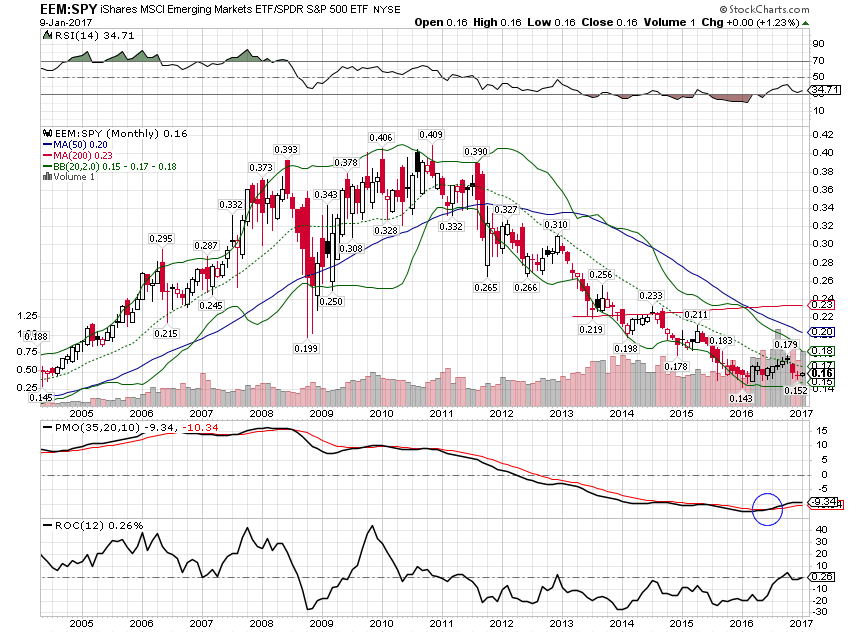
Long term momentum still favors EM stocks over S&P 500 as well. Momentum here has a pattern very similar to gold which isn’t surprising since both are very dollar sensitive. EM stocks have actually performed pretty well considering the trade rhetoric of the new Trump administration.
(Click on image to enlarge)
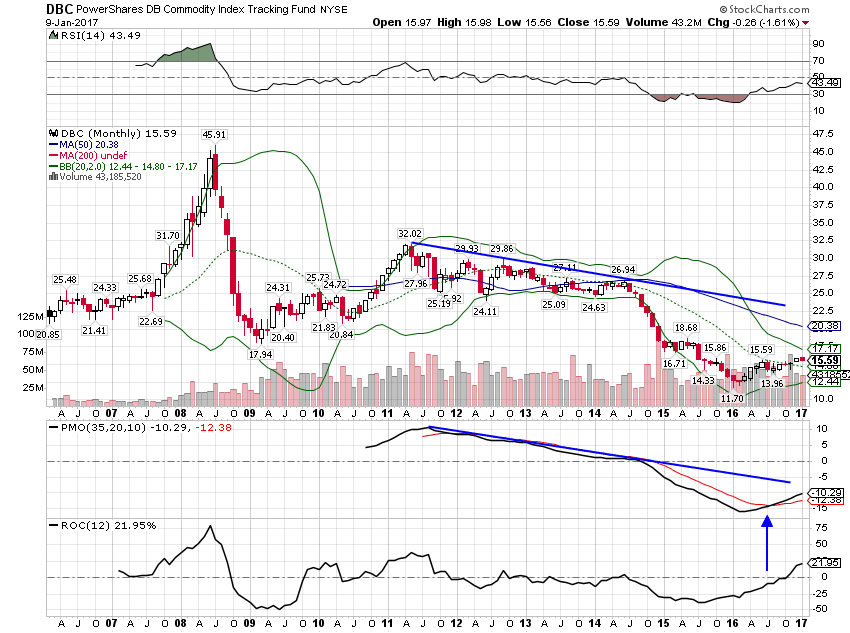
Commodities have maintained their positive momentum even as gold corrected; this isn’t just about the dollar.
(Click on image to enlarge)
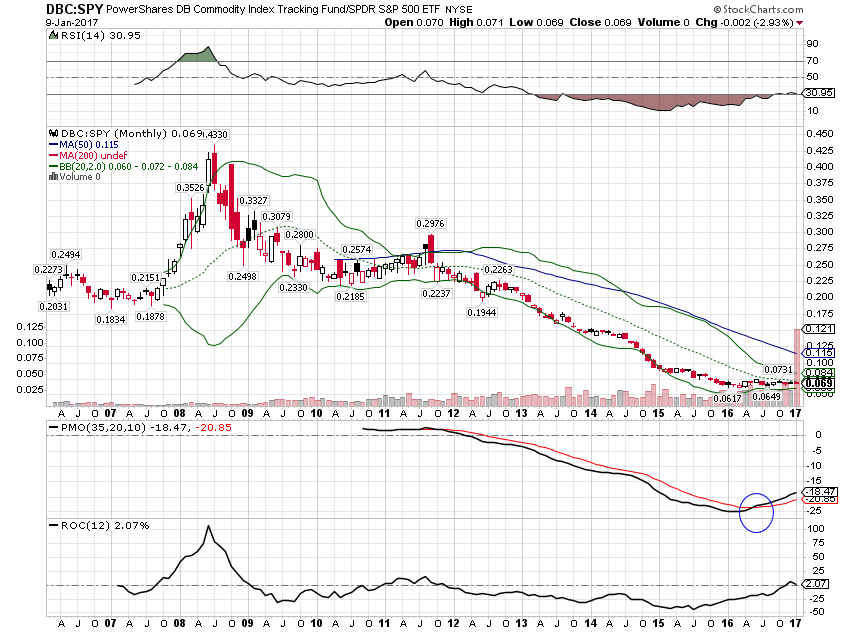
Commodities also maintained their momentum advantage versus US stocks.
(Click on image to enlarge)
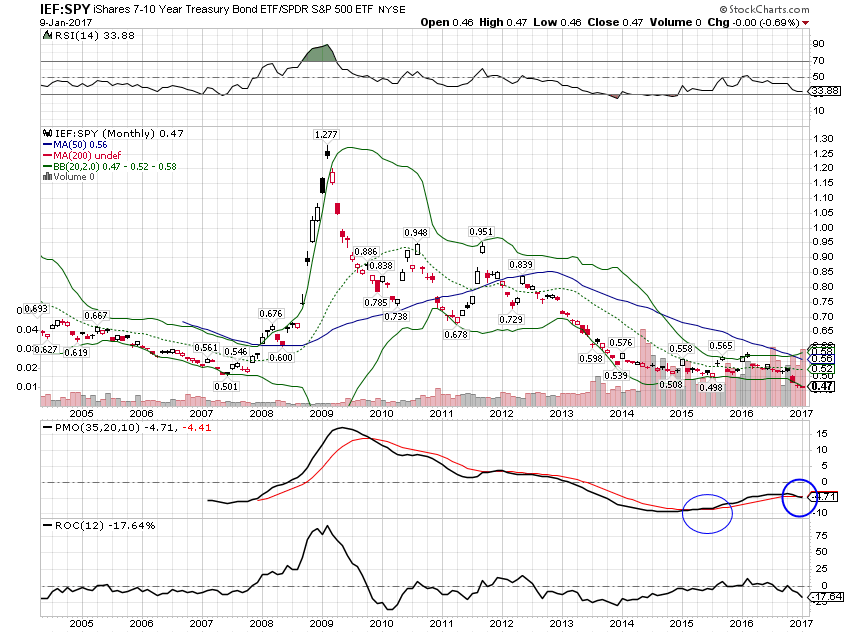
One area where long term momentum has shifted is in bonds versus stocks. That may be temporary after the big correction as short term momentum has turned back up, but for now I am hard pressed to favor one over the other.
(Click on image to enlarge)
Long term Treasuries did hold the long term trend line though so I wouldn’t get too negative. I still think the bond bull market is intact. There are entirely too many bond bears on for this to be a top.
(Click on image to enlarge)

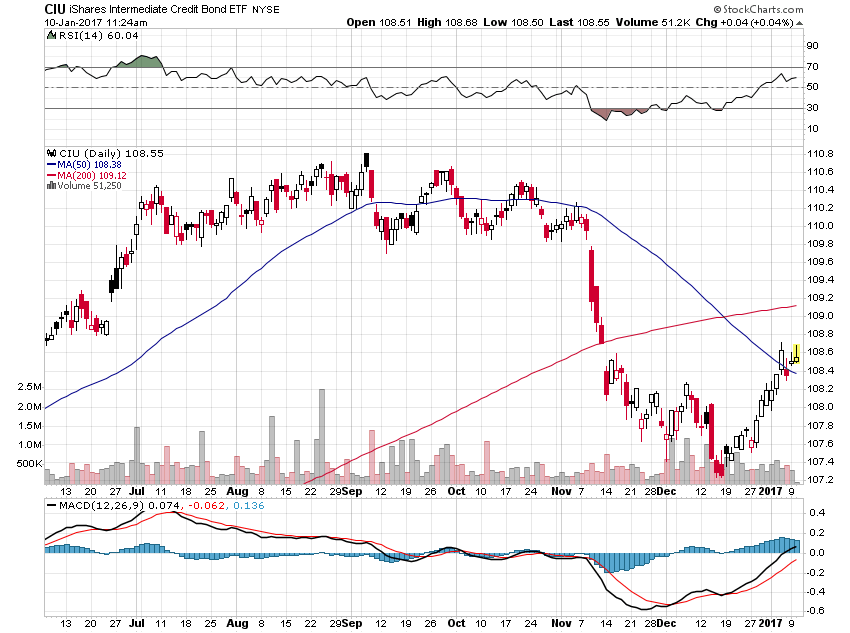
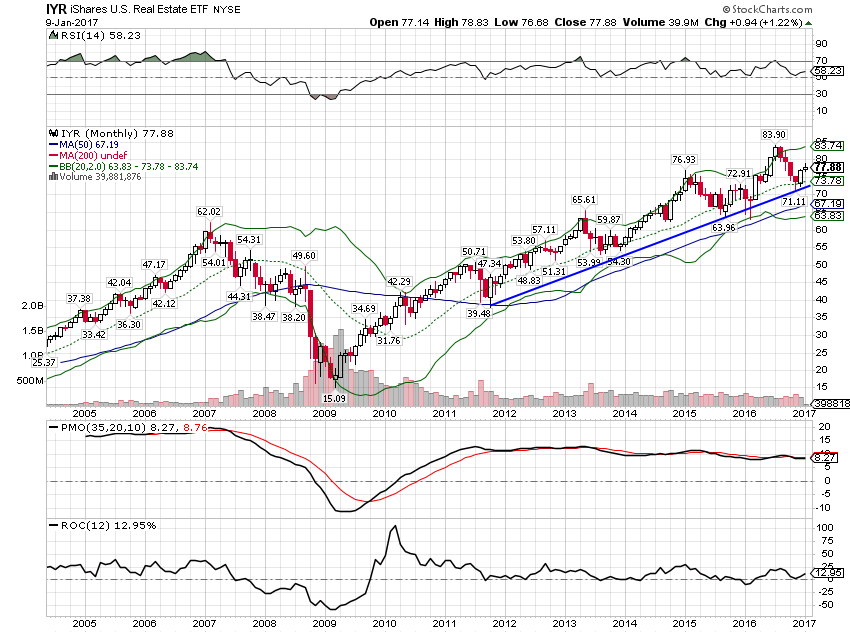
Last month I extended the duration of our bond portfolio by adding to IEF at what I expected to be technical support. I also added to IYR near its long term uptrend line. Both of those trades are working so far but I feel no urgency to add to the positions. Adding more duration is very tempting – TLT looks like a long term buy – but I think we need to see how the economic data comes out over the next month or two. My impression is that growth has picked up somewhat globally and I don’t know how long that will last or how big a change it is yet. Adding duration now feels like getting too far out on a limb. Instead, I think adding a little bit of credit risk to the portfolio makes sense in light of the improved growth outlook. I’ll replace SHY (1-3 year Treasury ETF) with CIU (iShares Intermediate Credit Bond ETF). It extends duration slightly to 4.71 years but more than doubles the yield.
(Click on image to enlarge)

(Click on image to enlarge)
(Click on image to enlarge)
Portfolio Changes
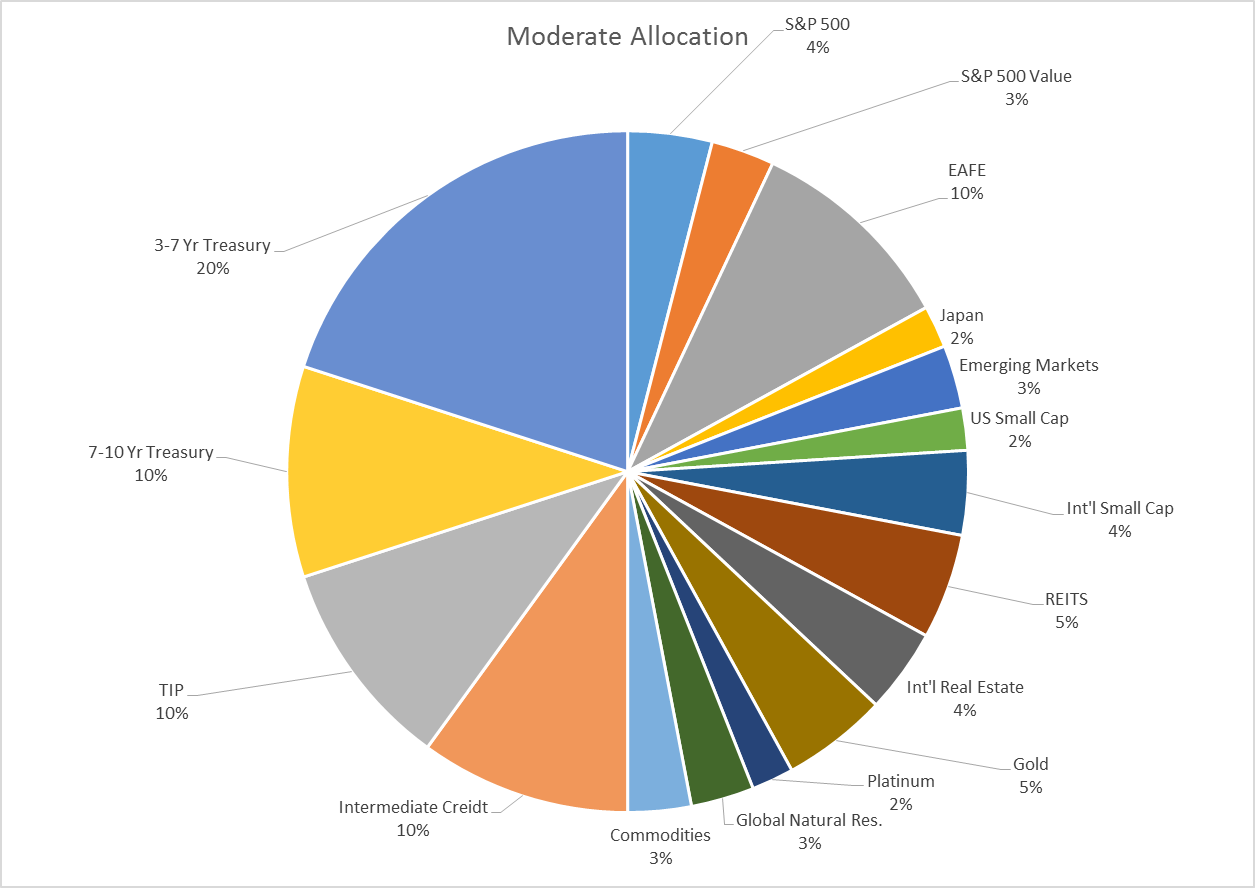
- Replace SHY with CIU
- Replace part of the gold holdings with platinum. Gold down to 5% and platinum initiated at 2%.
Both of these changes are a slight shift of the portfolio toward growth. Absent further evidence of better growth prospects from the bond market I cannot justify a larger move. I expect to see some volatility after the inauguration as the policy debate starts in earnest. In the meantime, global growth does look a little better although it is likely a cyclical change not a secular one.
Moderate allocation now looks like this:
(Click on image to enlarge)
The changes this month continue the slight shift toward growth that started last month. While growth expectations actually fell back a bit based on bond markets, the economic data has been supportive, especially from a sentiment standpoint. However, valuations are still too high and momentum in stocks too tentative to have a full allocation to risk assets. And frankly, I’m still skeptical of the policy mix being offered by the new administration, especially on trade. By the update next month, the policy debate will be in full swing and we’ll have a better idea how contentious the negotiations are going to be.
Disclosure: This material has been distributed for ...
more

