
GDX Rally May Fail
- SPX Monitoring purposes; Long SPX on 3/24/17 at 2343.98.
- Monitoring purposes Gold: Sold GDX at 24.33 on 2/22/07 = gain 20.15%; Long GDX on 12/28/16 at 20.25.
- Long Term Trend monitor purposes: Covered short SPX on 3/24/17 at 2343.98: Short SPX on 1/13/16 at 1890.28
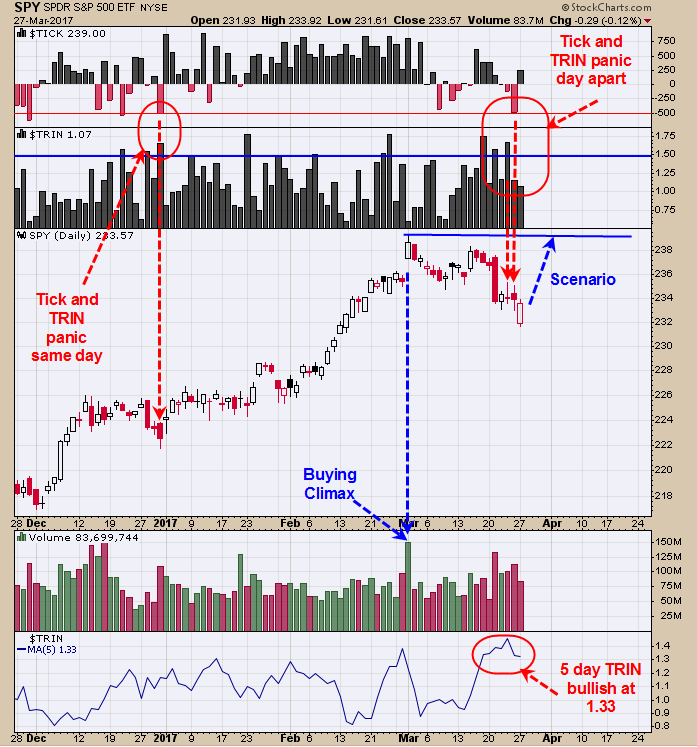
The TRIN closed last Thursday at 1.67. Readings above 1.50 show panic. No panic reading was recorded on the Tick last Thursday but Friday they did with a reading of -486 triggering a bullish setup. This bullish setup by the Tick and Trin can produce a bottom the same day as the panic readings to as late as two days later. With today’s rally from the gap down opening suggests today could have been the low. Also the Equity Put/Call and Total put/call ratio gave bullish readings late last week and added to the bullish short term setup.
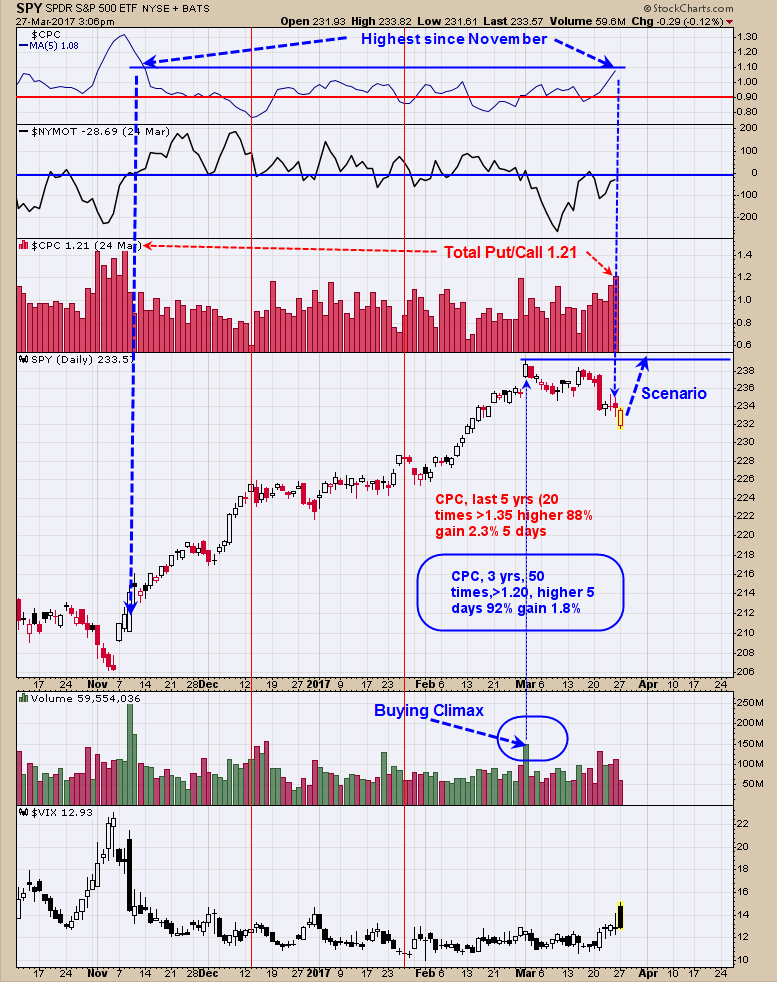
Total Put/Call ratio (CPC) closed Friday at 1.21. Readings of 1.20 and higher occurred 50 times over the last three years and market was higher five days later 92% of the time with an average gain of 1.8%. A 1.8% rise would put the SPY (and SPX) back at the March 1 Buying Climax high. It still appears the March 1 Buying Climax high will be tested. If and when the March 1 high is tested, if tested on lighter volume could turn into a resistance area. For now a possible upside target is the March 1 high on the SPX near 2400.98. Long SPX on 3/24/17 at 2343.98.
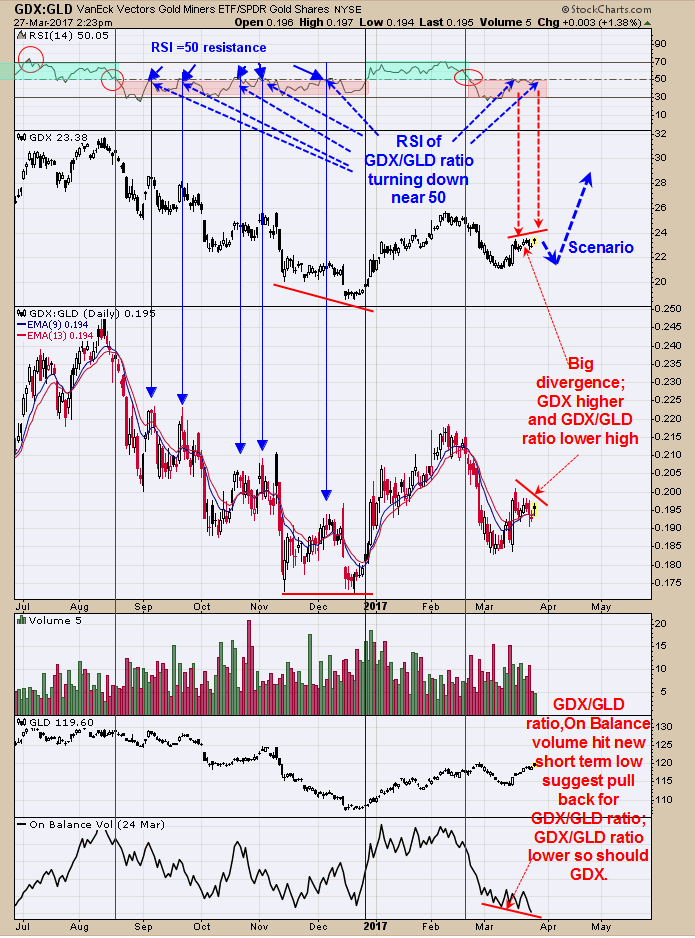
The third window up from the bottom is the GDX/GLD ratio. Normally this ratio leads the way for GDX. Recently, GDX/GLD ratio made a lower high as GDX made a higher high and a short term negative divergence. This condition suggests GDX rally may fail. The top window is the RSI for GDX/GLD ratio which is hovering around the 50 level. Readings above 50 shows GDX/GLD ratio is in an uptrend and bullish and below 50 in a downtrend and bearish. The RSI for the GDX/GLD ratio has been hovering near the 50 range and not showing strength and a bearish sign. The bottom window is the On Balance Volume for the GDX/GLD ratio which just hit a new short term low suggesting GDX/GLD ratio may weaken more. If GDX/GLD ratio weakens so should GDX. A pull back for GDX is still possible short term. Timer Digest has us ranked #1 in performance for gold over the last 12 months. Sold GDX at 24.33 on 2/22/17 = gain 20.15%; Long GDX on 12/28/16 at 20.25.


