
GDX Has Just Made A Powerful Bull Flag
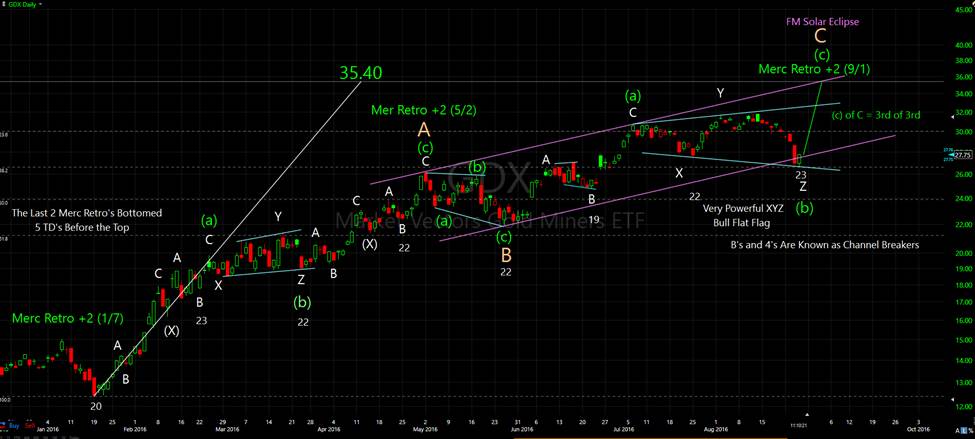
The GDX daily chart below shows a powerful xyz e-wave bullish flat that is projecting to 35.42 by September 1, two trading days past the Mercury Stationary/Retrograde date of August 30.As of August 25th, GDX has closed at 27.31 off the earlier low of 26.64.A 29% increase on GDX and a nearly 90% increase on NUGT in one week seems likely based on the information on the chart from the August 25th close!
The chart below shows repeating 19-23 trading day cycle lows since the low on January 19, 2016. The low this phase went all the way to 23 trading days. The last (c) of C wave is also known as a bear market rally third of a third, which has the power of a third wave, but in reality is more like a 5th wave because of its finality.Another word for this coming move might be better termed: a blow-off top.
There are no 5 wave sequences in this move up, making this year’s rally suspect, at least regarding higher highs after September 1 (at least for this year).My best guess is we are going to see new lows ahead for the precious metals complex as we approach the usual October-December 8-year cycle lows.
GDX has not seen this level of oversold conditions since the January lows. The only difference this time is that this looks to be a blow-off rally, while back in January was just the beginning of the rally.
(Click on image to enlarge)
As far as the stock market is concerned, there are way too many crosscurrents (cycle/wave/indicator/astro wise) going on to even get close to know where we headed in the short term.Ideally, we see a 10 week, 64 trading day top on September 7th and a major low on November 21.Saturn square Mars on August 24 presaged WAR and EARTHQUAKES.Turkey invaded Syria and we had an earthquake in Italy that killed 38 people.
Now we have Mars square Neptune on August 26 (squaring the north node of the moon on Sunday).Neptune rules crude oil and radical, misguided religion (like ISIS). Mars rules war. IF the stock market rallies to a new high on Friday (on the Yellen speech), we may see a fairly large drop next week into as late as Sept 1, but likely no lower than the mid 2130’s I would think in any case. Time will tell.
We use price/time targets as a road map of possibilities, not something necessarily to be traded. Keep that in mind when reading this or any other commentary on the markets. Stock market forecasting is much like the weather, it is constantly being updated. That is why we offer subscriptions.
Disclaimer: The information provided by the BluStar Market Timer is to be used for educational purposes only. We do not recommend the buying or selling of any securities, are not registered ...
more

