
GBP/USD In Focus As Brexit Grabs Attention; USD Pullback Continues
GBP/USD IN FOCUS AS BREXIT COMES INTO FURTHER VIEW
It’s a big day in the UK and we will likely see updated headlines throughout the session. Brexit negotiators have come to an agreement on a proposed deal, and at this point, Theresa May needs to sell it to her cabinet to gain approval. This appears to be a big ‘if’ at this point, but if successful, the door remains open for the later-month summit between the EU and the UK to further iron out details. This is far from a certainty, and given the volatility in UK markets around this theme yesterday, we may still be in for a bumpy ride.
Sterling initially popped-higher as news that negotiators had come to a resolution. But, as the draft of that deal leaked, optimism faded and prices soon moved back down to the 1.2900-handle. At this point, GBP/USD has had a rather active past few days of price action in both directions, and Theresa May is currently pitching this proposal to her cabinet.
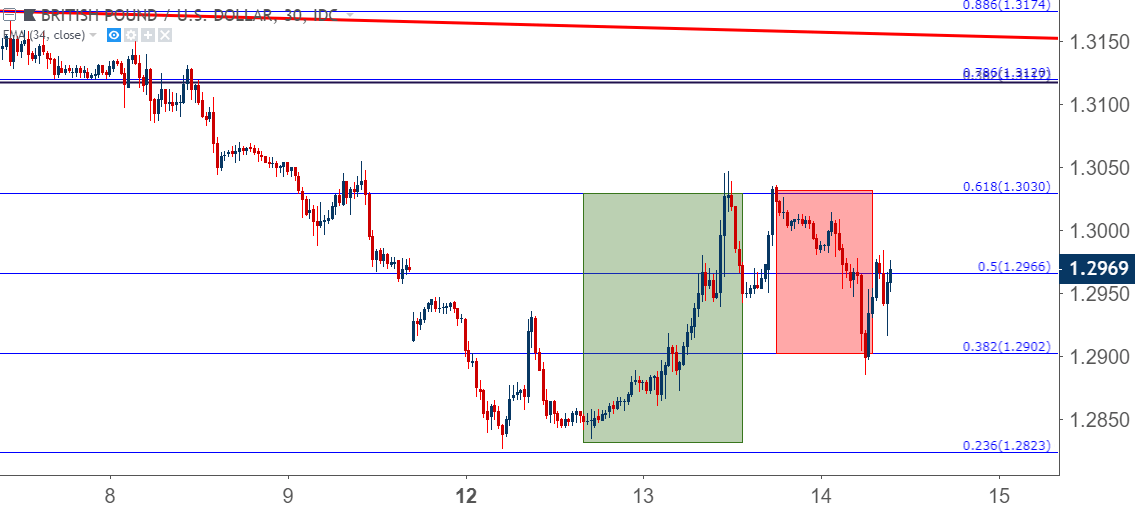
GBP/USD 30-MINUTE PRICE CHART: TWO-WAY VOLATILITY THIS WEEK AS DRIVEN BY BREXIT HEADLINES
(Click on image to enlarge)
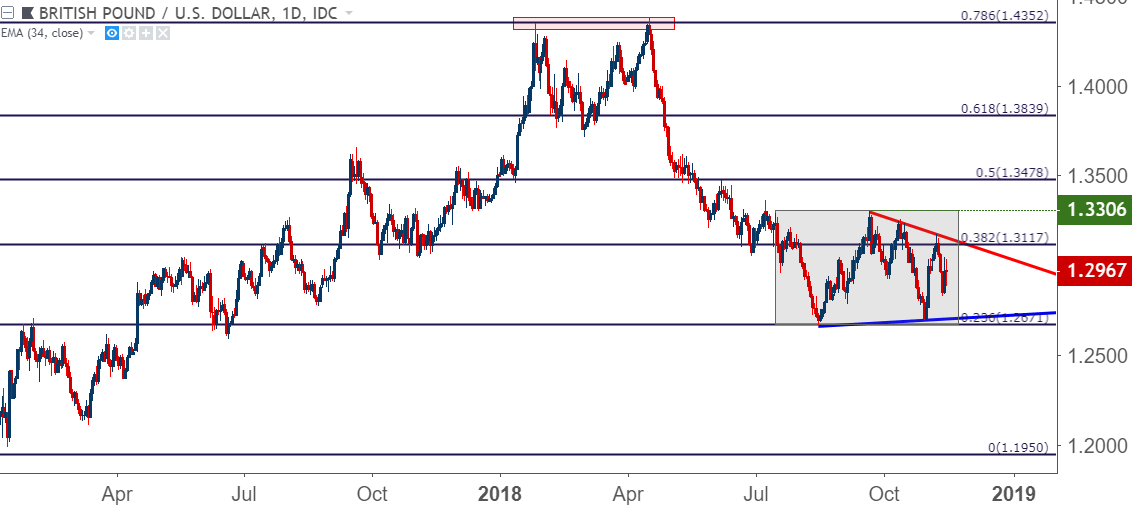
On a longer-term basis, GBP/USD continues in a rather aggressive range that’s been in play for almost four months now. Prices in the pair were on a bee-line lower from April and into July, but in mid-August ran into a key Fibonacci retracement that finally helped to stem the bleeding. This level takes place at 1.2671, and this is the 23.6% Fibonacci retracement of the Brexit move in the pair, taking the June, 2016 high down to the October 2016 low.
Since that support came into play in mid-August, prices have been displaying an element of mean reversion with both lower-highs and a slightly higher-low coming into play. This can complicate trend strategies on shorter-term charts given lack of recent sustainable trends. But – it can also highlight levels of interest that may come into play for longer-term strategies; with bulls looking for topside breaks through levels like 1.3117 or, perhaps a bit further away at the three-month-high of 1.3306 to usher in topside strategies on the pair.
GBP/USD DAILY PRICE CHART
(Click on image to enlarge)
US DOLLAR FILLS SOME GAP, BUT TRAP POTENTIAL REMAINS
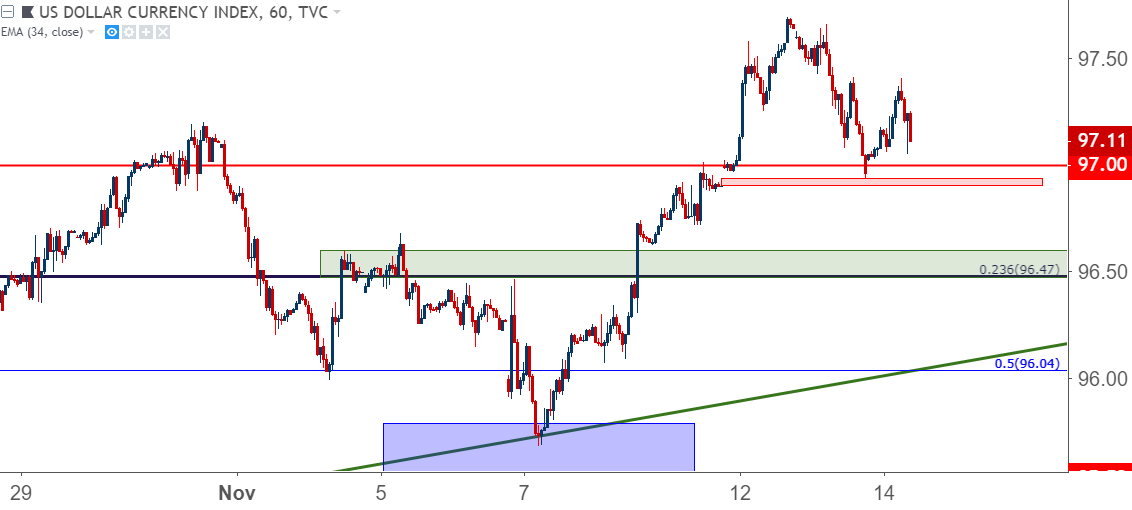
In yesterday’s webinar, I looked at the US Dollar as there was a potential bull trap in the making. Prices in the currency gapped-higher to start this week’s trade, and after a really strong Monday continued to push away from that price. As I discussed yesterday, markets will have a tendency to fill those gaps and the fact that it hadn’t kept the door open for deeper pullback potential.
That led into some downside run in USD until prices pushed down to a fresh weekly low. A portion of that weekend gap has been filled, but a small amount of gap remains, and the currency may not yet be in a spot for bullish strategies after the aggressively bullish move of the week prior. Deeper support potential remains around the 96.47 level, which is the 23.6% Fibonacci retracement of the 2011-2017 major move in DXY.
US DOLLAR HOURLY PRICE CHART
(Click on image to enlarge)
EUR/USD TESTS RESISTANCE AT PRIOR SUPPORT
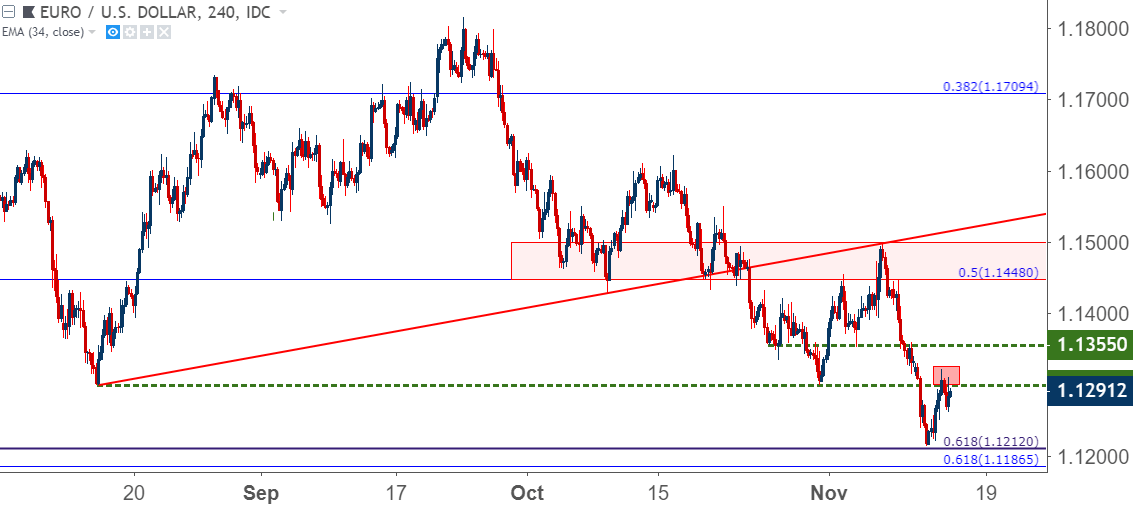
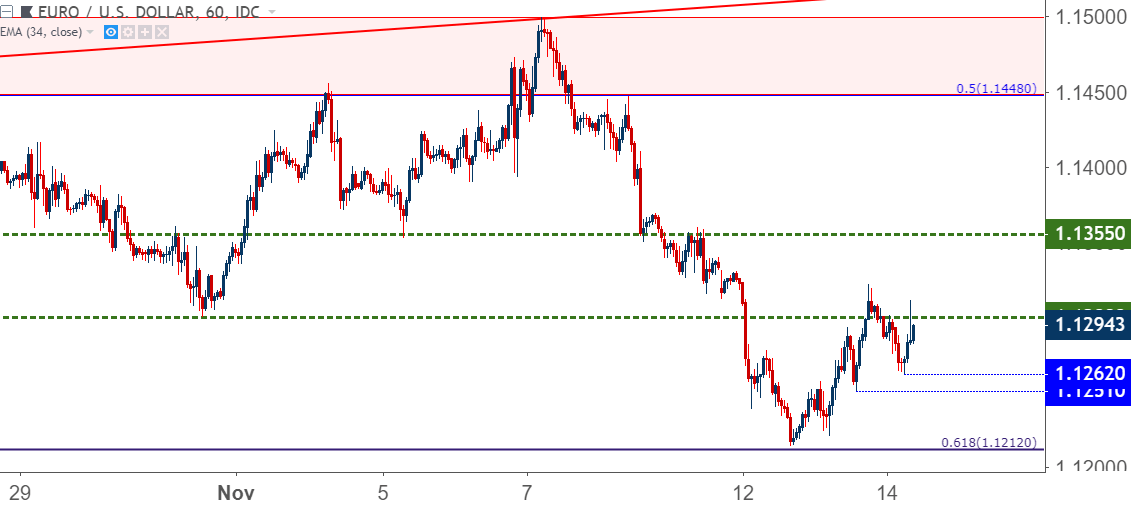
On the long side of the US Dollar, few markets have been as attractive as EUR/USD so far this month. As worries remain with the Italian budget issue garnering greater attention, bears have remained fairly active in the pair, pushing from a 1.1500 resistance test last week down to a fresh yearly low set on Monday of this week. Sellers pulled up just shy of a key Fibonacci level at 1.1212, which is the 61.8% retracement of the 2000-2008 major move in the pair.
Since that Monday low, prices have been pulling back in the pair and a bit of resistance has shown off of that prior support level at 1.1300.
EUR/USD FOUR-HOUR PRICE CHART
(Click on image to enlarge)
On shorter-term charts, buyers haven’t yet shown a sign of letting up. Prices pushed above 1.1300 temporarily yesterday before a pullback developed. But, around this morning’s European open bulls returned to show higher-low support, indicating that we may see continued drive-higher to a deeper level on the chart. The level I looked at in yesterday’s webinar is around the 1.1355 area.
EUR/USD HOURLY PRICE CHART
(Click on image to enlarge)
NZD/USD REMAINS ATTRACTIVE FOR SHORT-USD STRATEGIES
Perhaps a bit lost in the shuffle with all of the major items on the wires out of Europe and the UK has been the development of a respectable bullish trend in NZD/USD. I started looking at the pair for short-USD strategies last month, and since then prices have pushed up to fresh three-month-highs. Despite the fact that USD has continued to push up to fresh yearly highs, NZD/USD has continued to push-higher; and if markets do bring a bigger sell-off or reversal or pullback in the US Dollar, this pair remains attractive.
Buyers came in to show higher-low support above the .6700 handle on Monday, and prices are now making a fast approach towards those fresh three-month-highs. This pair can, at the least, avoid a bit of the headline-driven flow emanating from Europe as issues around Brexit and the Italian budget continue to push prices in either direction.
NZD/USD EIGHT-HOUR PRICE CHART
(Click on image to enlarge)
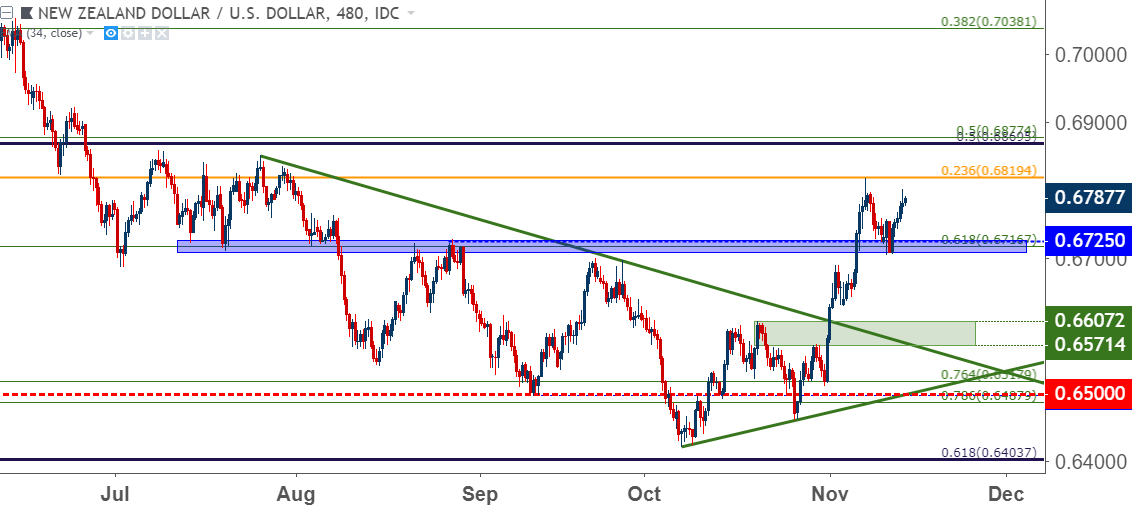
Chart prepared by James Stanley
Disclosure: Do you want to see how retail traders are currently trading the US Dollar? Check out our IG Client Sentiment ...
more

