
GBP/USD Breakout Accelerates Bearish Momentum
GBP/USD
4 hour
(Click on image to enlarge)
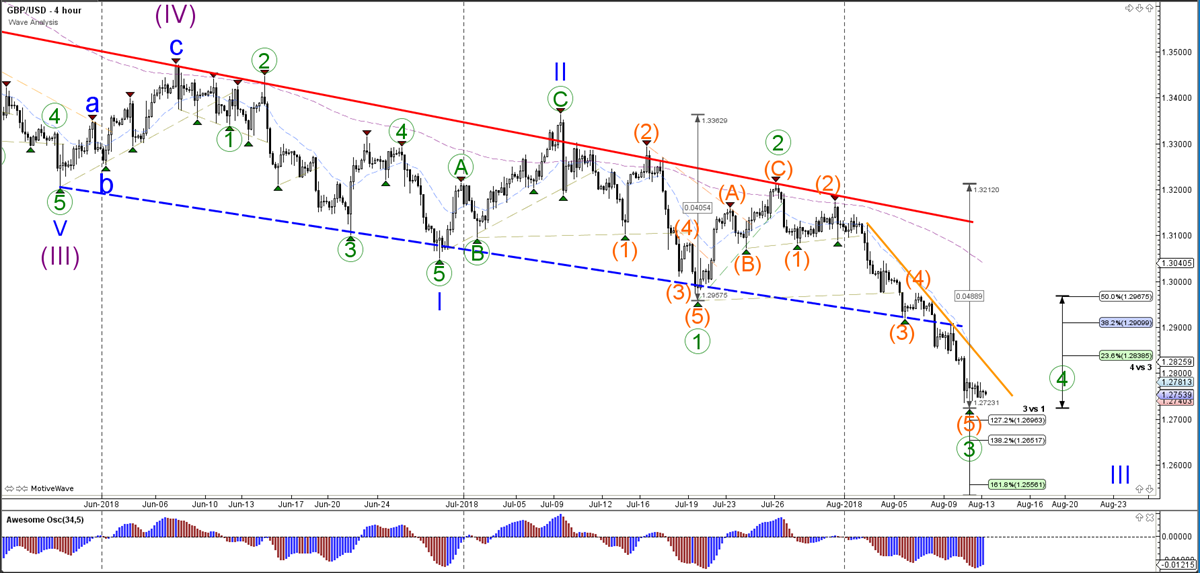
Source: Admiral Markets MT5 with MT5SE Add-on GBP/USD motive wave
The GBP/USD broke the support line (dotted blue) of the downtrend channel. The bearish breakout is behaving very impulsively, which indicates that the swing is a potential wave 3 (green). A bearish break could extend the 3rd wave towards the Fibonacci targets of wave 3 vs 1, whereas a bullish retracement could bounce at the resistance of the Fibonacci levels of wave 4 vs 3.
1 hour
(Click on image to enlarge)
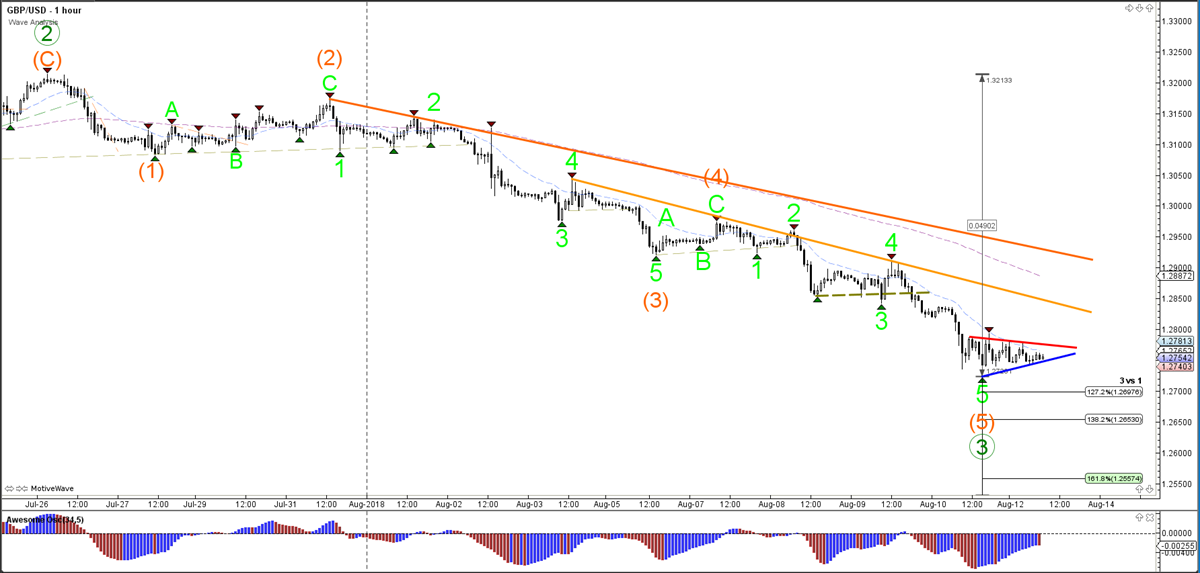
Source: Admiral Markets MT5 with MT5SE Add-on GBP/USD motive wave
The GBP/USD is building a triangle chart pattern. A bearish breakout could extend the wave 3 (green) to a lower low, and could fall down to the Fibonacci targets. A bullish break is probably limited in its movement, as the price is hitting resistance trend lines (orange).
Disclaimer: The opinions in this article are for informational and educational purposes only and should not be construed as a recommendation to buy or sell the stocks mentioned or to solicit ...
more

