
GBP/USD – Double Bottom Or Further Declines?
In the previous week, GBP/USD wavered around the lower border of the declining trend channel. Yesterday, currency bears pushed the pair below it, testing the mid-November low. Will we see a post-double-bottom rally in the following days?
Which Way Next for EUR/USD?
(Click on image to enlarge)
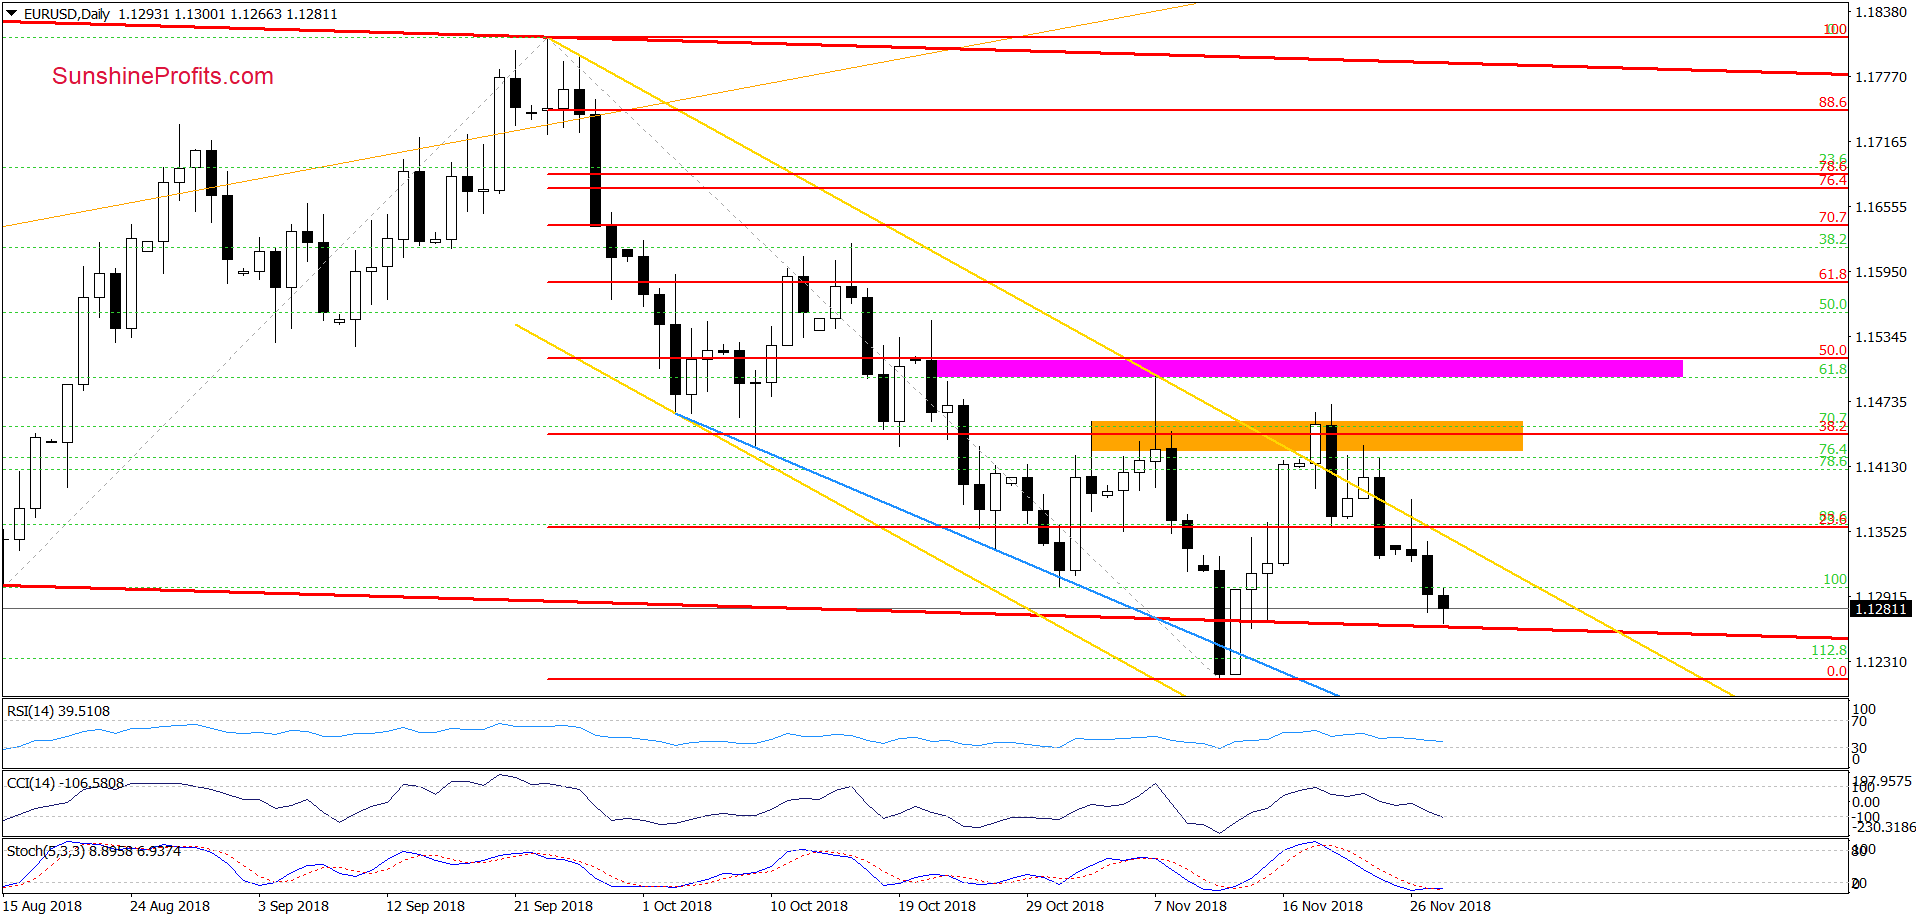
On Monday, we wrote the following
The buyers pushed the pair above the yellow line once again, but as it turned out this improvement was very temporary, and EUR/USD pulled back, invalidating the breakout for the third time in a row. Such price action increases the probability that we’ll likely see further deterioration and a test of the lower border of the red declining trend channel (or even the recent lows) in the coming days.
From today’s point of view, we see that the situation developed in line with the above scenario and the exchange rate touched our first downside target earlier today. As you see on the chart, the lower border of the red trend channel triggered a tiny (compared to earlier declines) rebound in the following hours, but as long as there are no buy signals generated by the daily indicators and a comeback above the yellow resistance line, one more downswing and a test of the next downside target is likely.
GBP/USD – Double Bottom?
(Click on image to enlarge)
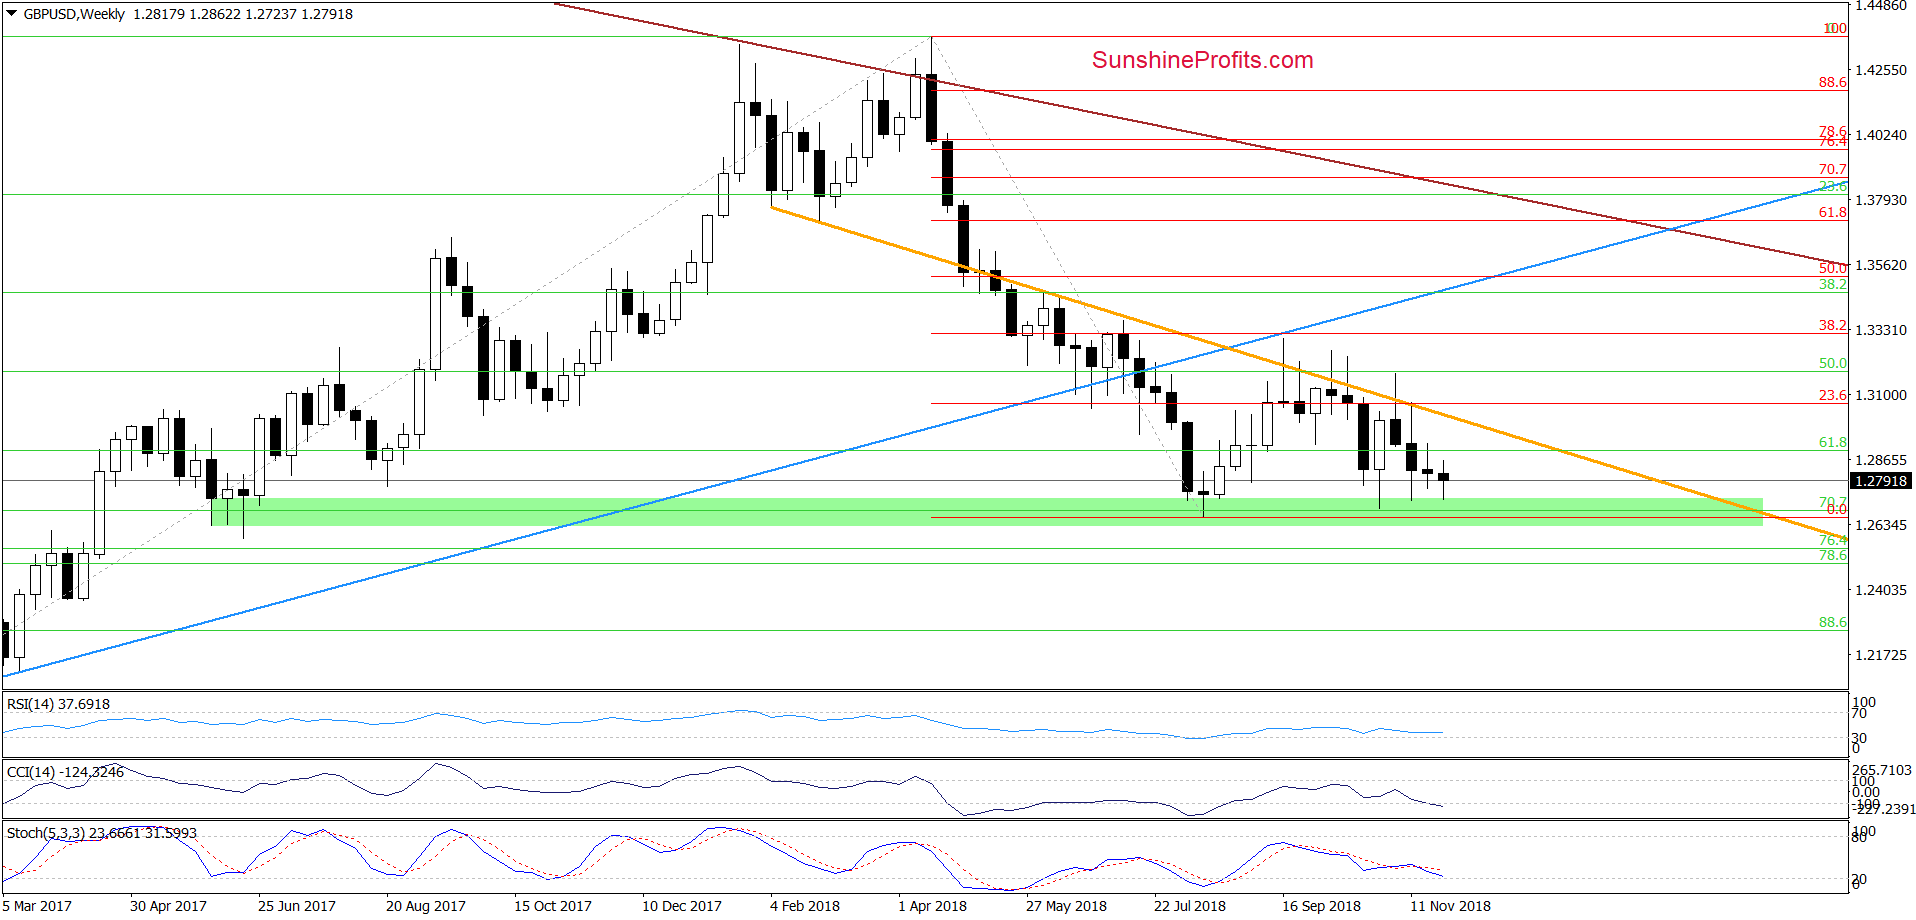
Looking at the weekly chart, we see that GBP/USD slipped to the green zone once again. As you see, this major support area was strong enough to stop the sellers three times in the past, which suggests that as long as there is no successful breakdown below it a bigger move on the downside is not likely to be seen and one more rebound from here should not surprise us – especially when we factor in the short-term picture below.
(Click on image to enlarge)
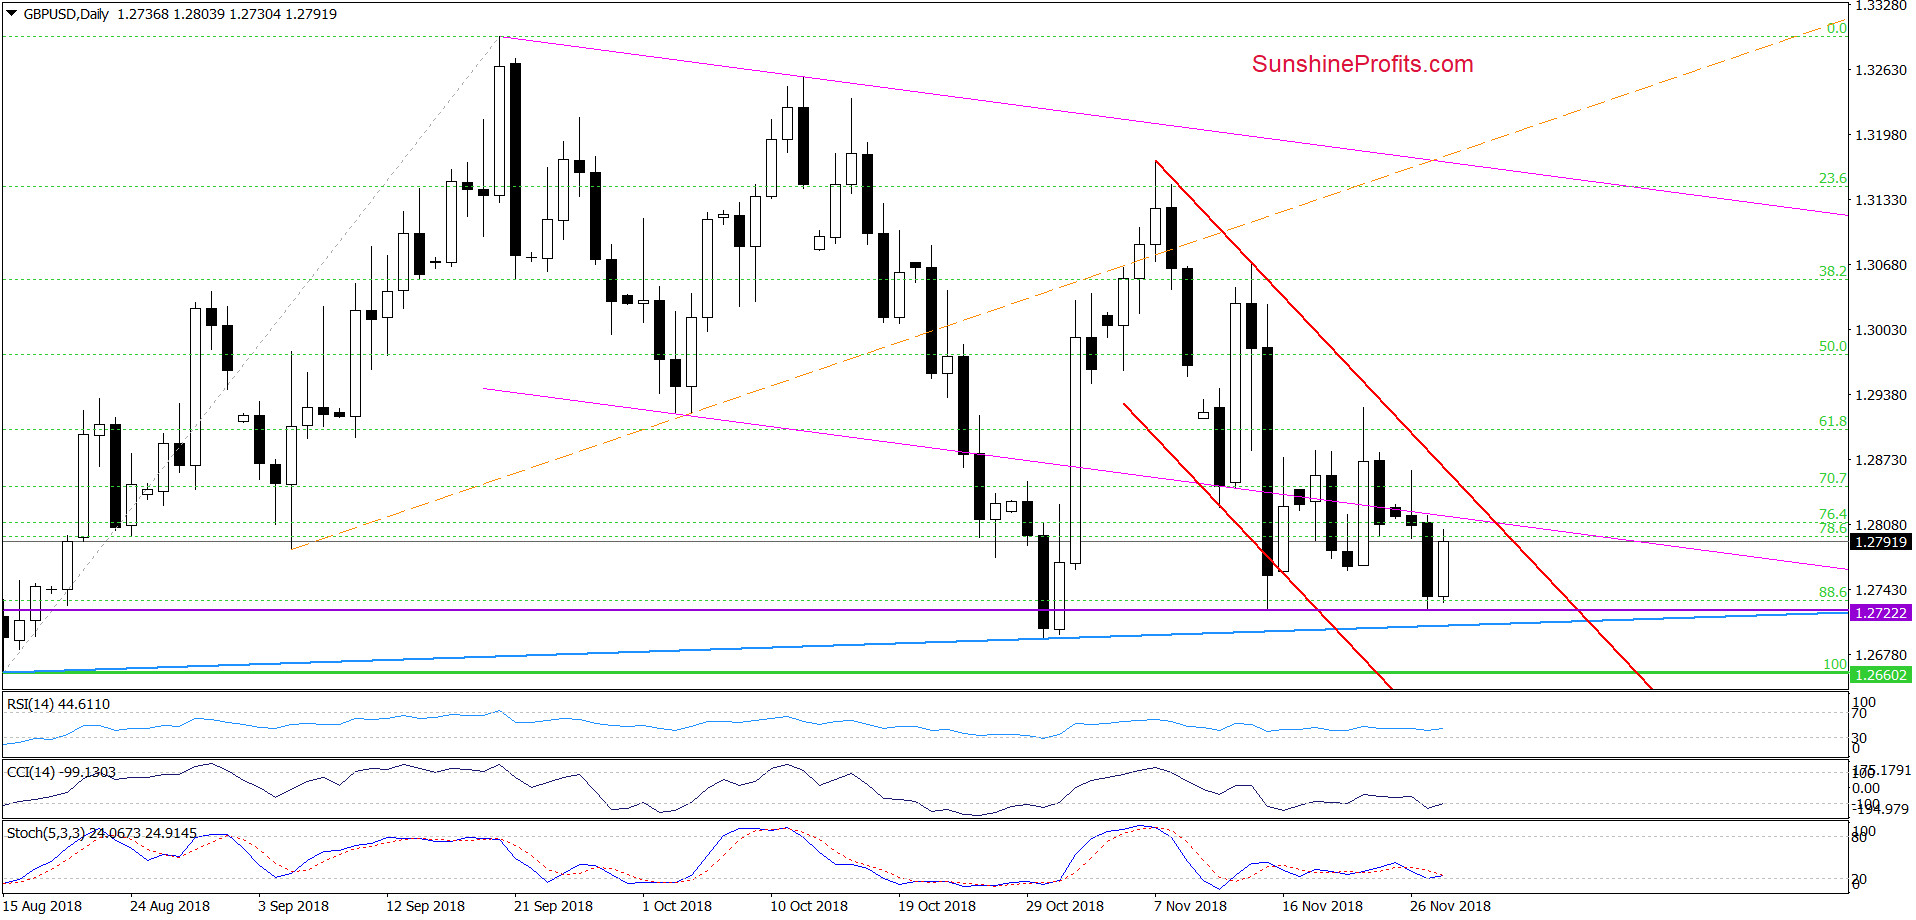
From this perspective, we see that the exchange rate dropped to the purple horizontal line based on the mid-November low during yesterday’s session. Earlier today, currency bulls bounced off this support, erasing almost entire Tuesday’s downswing and approaching the previously-broken lower border of the pink declining trend channel.
On one hand, such price action could be nothing more than a verification of the earlier breakdown, however, on the other hand, taking into account the probability of a double bottom, the proximity to the above-mentioned green support zone (marked on the weekly chart), the blue support line seen on the daily chart and the current position of the daily indicators, it seems that further improvement is just around the corner.
Nevertheless, in our opinion, a bigger move to the upside will be more likely and reliable if currency bulls manage to take the pair above the upper border of the red declining trend channel marked on the daily chart.
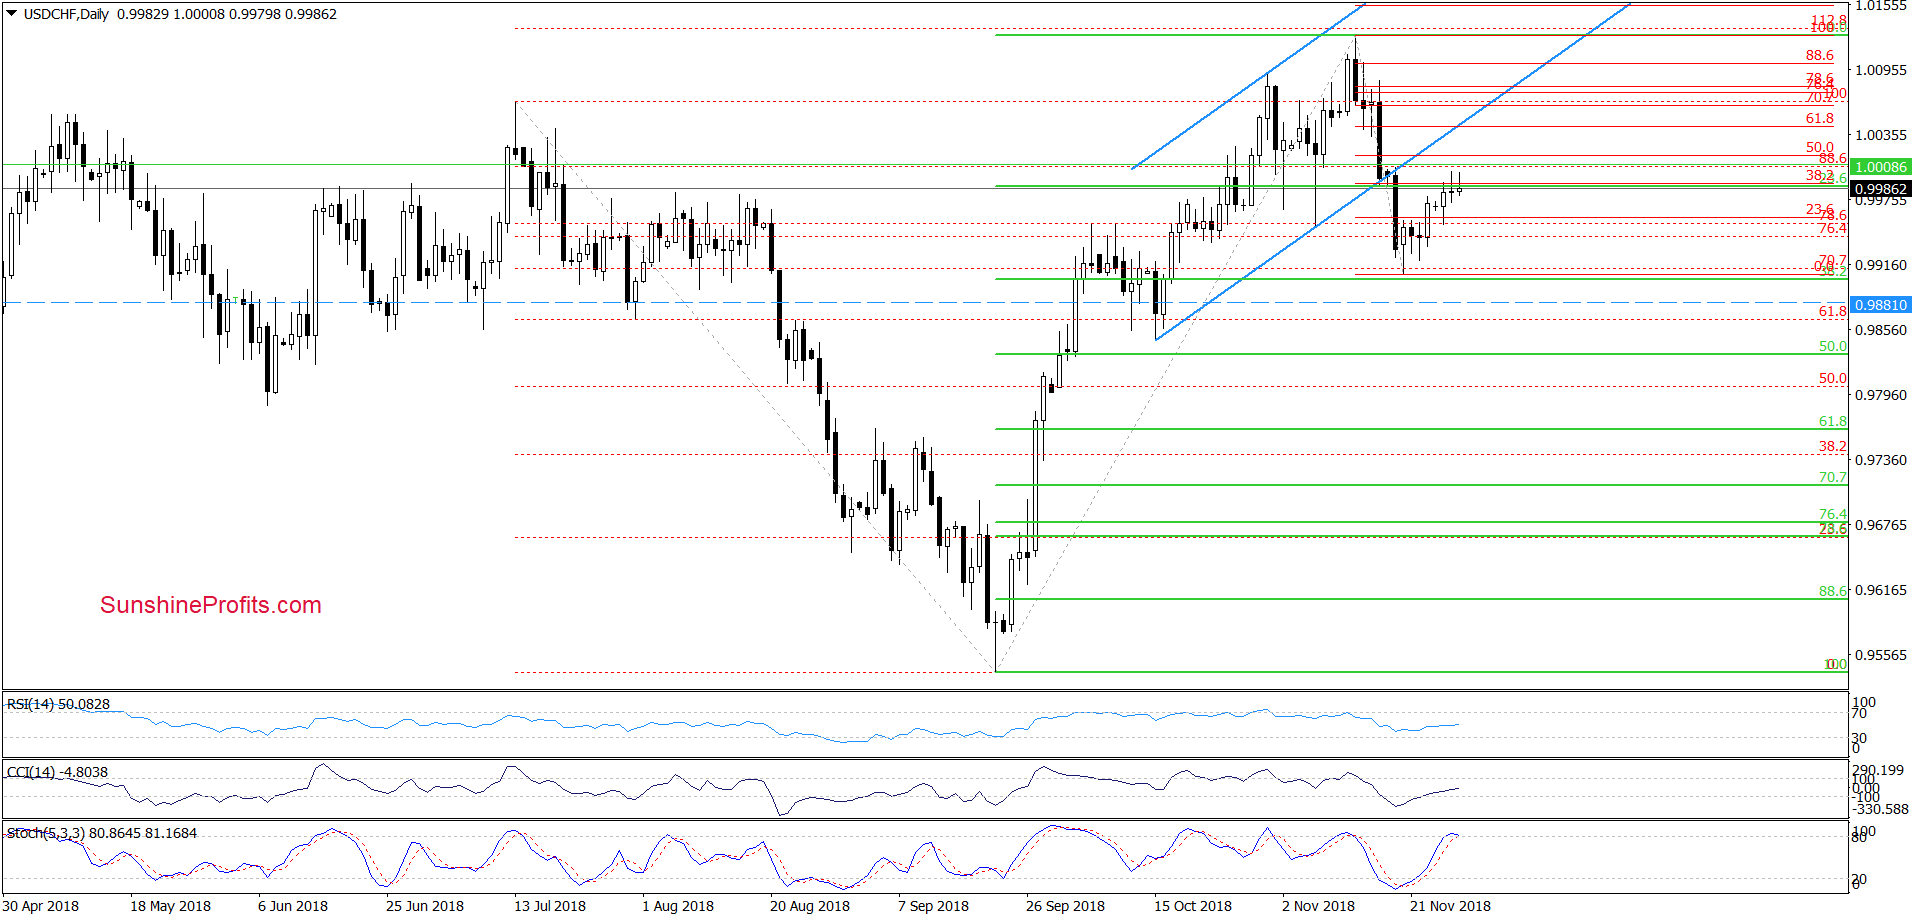
USD/CHF and Signs of Bulls’ Weakness
(Click on image to enlarge)
(Click on image to enlarge)
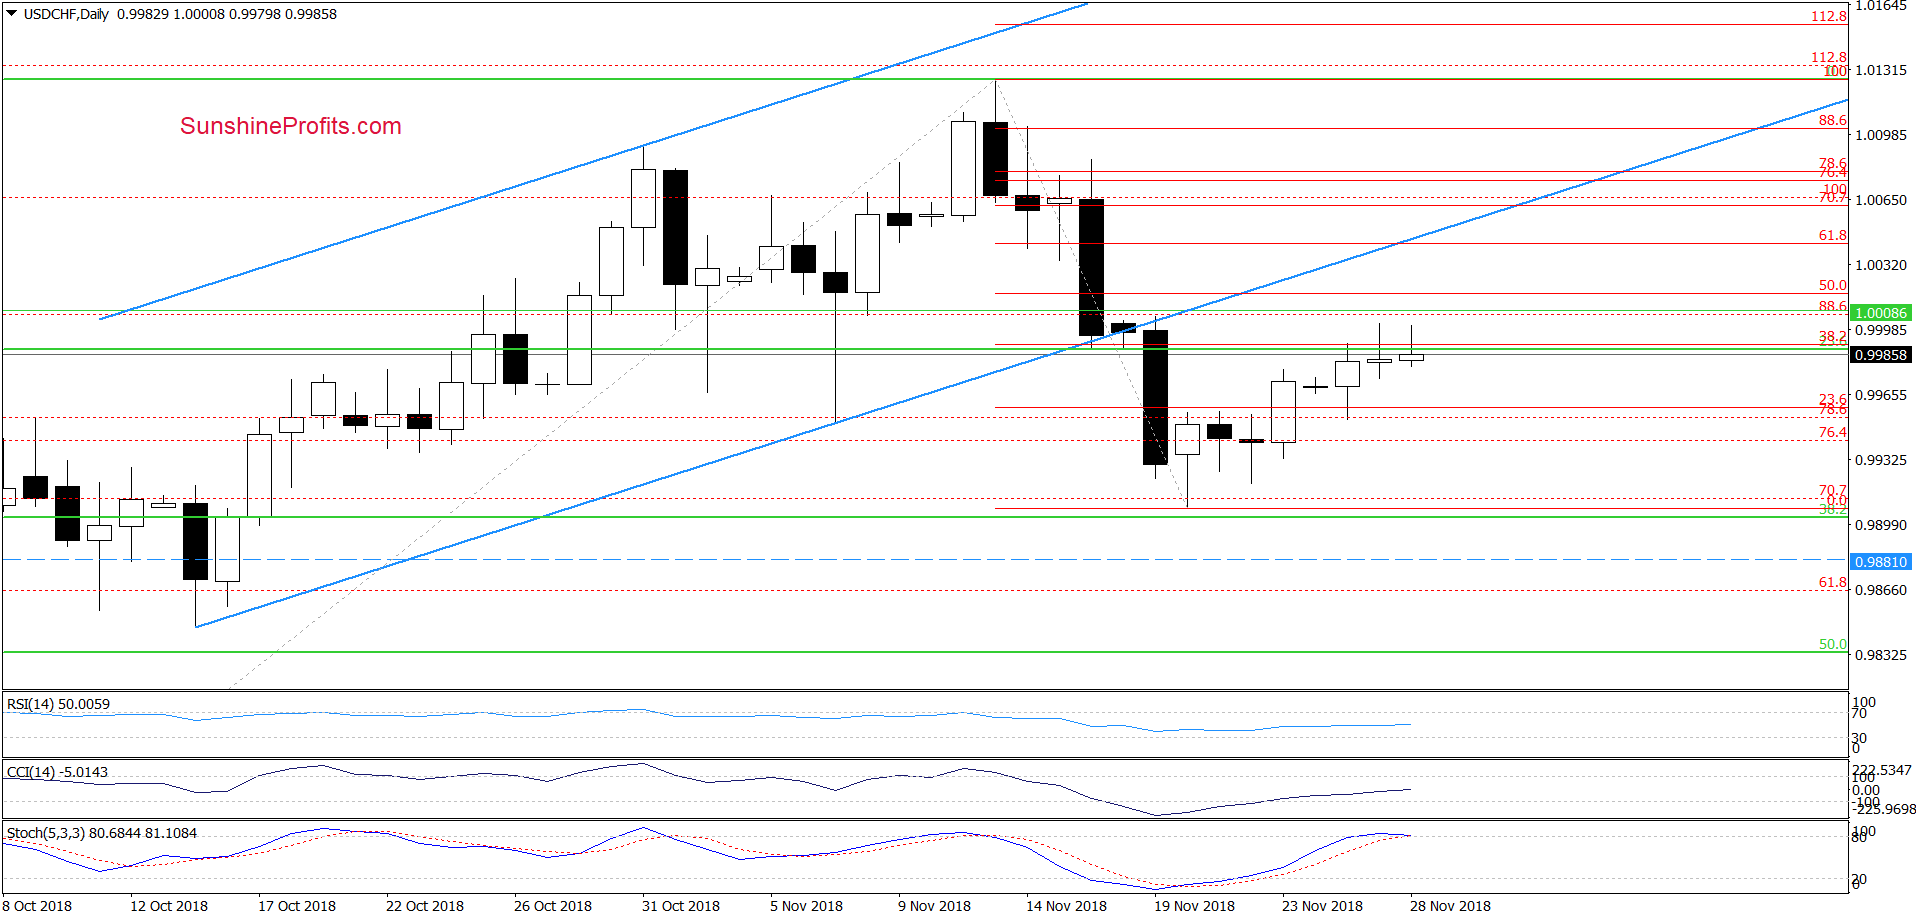
On the daily chart, we see that although USD/CHF increased a bit above yesterday’s high, the overall situation in the very short term remains almost unchanged as the pair is still trading inside the big black candlestick created on November 19.
Such price action suggests that currency bulls are quite weak compared to their opponents because despite eight sessions they were not able to return above 1.0005 (the November 19 intraday high).
Additionally, when we take a closer look at the Fibonacci retracements based on the November declines, we see that the exchange rate invalidated yesterday’s tiny breakout above the 38.2% retracement. Earlier today, the history repeated itself once again, increasing the probability of reversal in the very near future.
This scenario is also reinforced by the current position of the Stochastic Oscillator, which is very close to generate a sell signal. At this point, it is worth noting that a similar reading of the indicator preceded the November 13 peak.
Connecting the dots, we think that another attempt to move lower is just around the corner. If this is the case and the pair reverses from current levels, we’ll likely see a test of the 38.2% Fibonacci retracement or even the mid-October lows in the coming week.


