Friday The 13th Major Sector Winners & Losers: Energy & Financials May Hold The Key
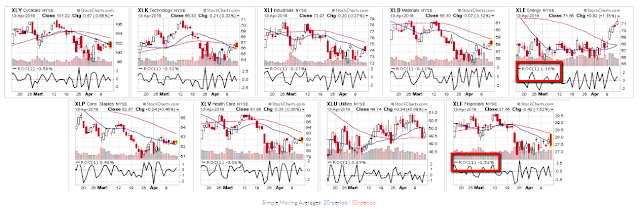
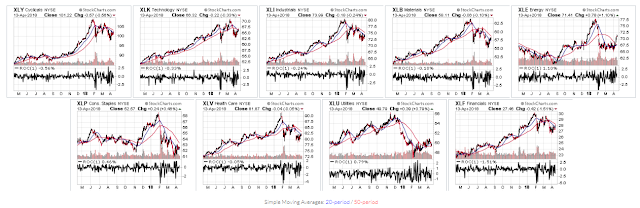
With an input value of 1 day, the rate-of-change indicator shows which of the following 9 Major Sectors gained/lost the most in today's action (2-month and 1-year daily charts below).
In this regard and in particular, watch for any continued strength in XLE (Energy) and any continued weakness in XLF (Financials) next week and beyond, which may equate to equity weakness, in general.
(Click on image to enlarge)
(Click on image to enlarge)
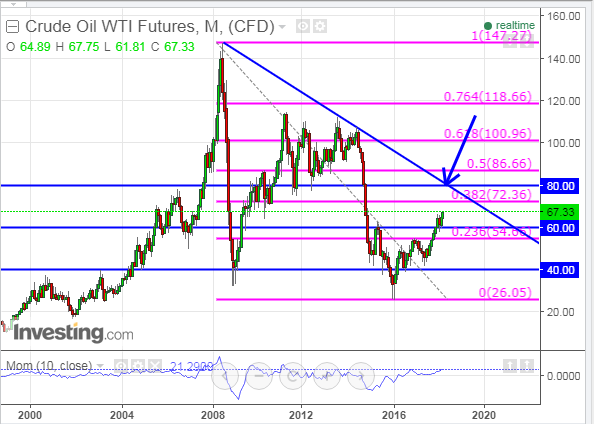
The monthly chart below of WTIC Crude Oil shows a longer-term view of price action, particularly with respect to a large reverse Head & Shoulders pattern that has been developing since the end of 2014.
It appears to be headed toward its first resistance at 72.36 (40% Fibonacci retracement), and potentially its next one around 80.00 (price and downtrend line convergence). The momentum indicator is in uptrend on this timeframe. Watch for a hold above major support at 60.00.
(Click on image to enlarge)
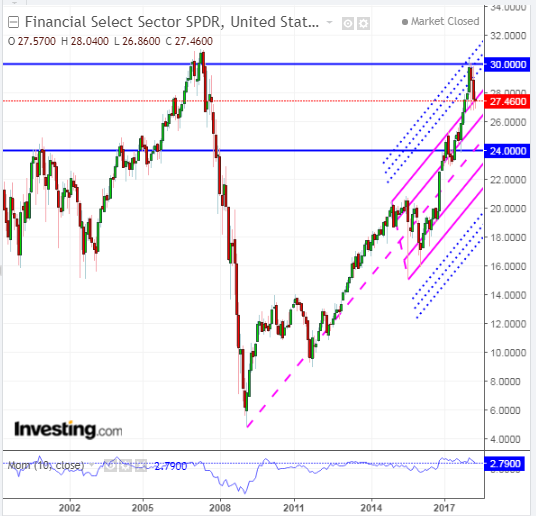
Conversely, XLF is in danger of dropping back to its major support level at 24.00, as it has failed to make a new all-time high recently, as shown on the following monthly chart. In fact, it was rejected at a 200% Fibonacci level on its long-term upward trending Andrew's Pitchfork channel and is sitting right on the outside edge of the top of that channel.
Its downward momentum has accelerated and is hovering just above the zero level. Watch for a drop and hold below zero on any further price weakness as an indication that 24.00 may eventually be retested, which happens to converge with the channel median, at the moment.
(Click on image to enlarge)