
Fortress TIC
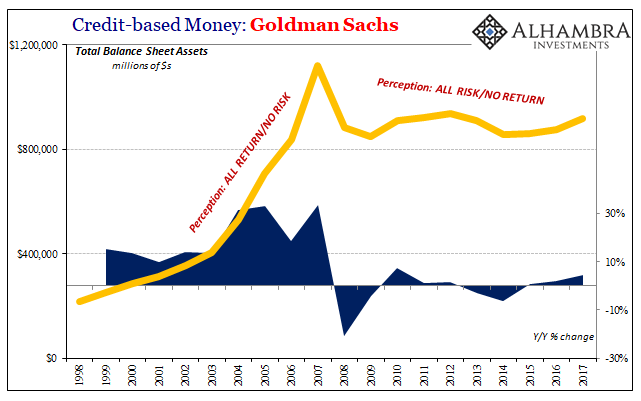
Goldman Sachs reported FICC revenues of just $1 billion in Q4 2017. That was the lowest for the Wall Street firm, technically a bank, since it converted from properly a securities business to one during the worst of 2008. That was 50% less in “bond trading” than Goldman had produced during Q4 2016. You start to get the sense that these banks can only make money here during obvious and rapid “reflation.”
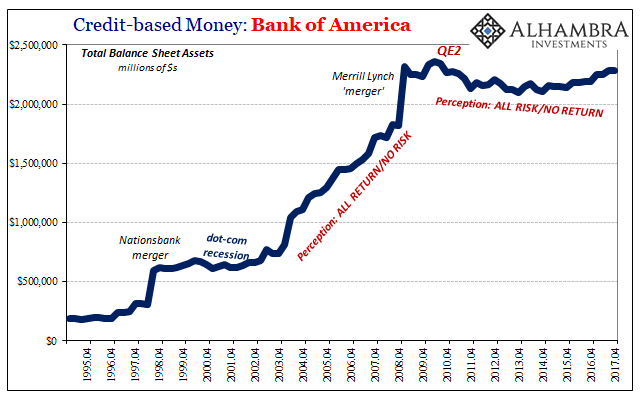
They were not alone in their Q4 struggles. Predictably, other large firms once very active in money dealing have reported this week less than stellar results in FICC. At the upper end, Bank of America (including Merrill Lynch) figures it brought in $1.71 billion in the segment, a decline of 13% year-over-year. The bank cited, what else, but lower volatility as a primary cause.
JP Morgan was closer to Goldman than BofAML in bond trading. Fixed Income Markets revenue was reported to be just $2.2 billion in the quarter, a year-over-year decline of 34%.
All of these banks, as well as their peers I haven’t included here, keep saying how great their business is. And all of these banks continue to shrink anyway (growing a little is still shrinking).
(Click on image to enlarge)
(Click on image to enlarge)
(Click on image to enlarge)
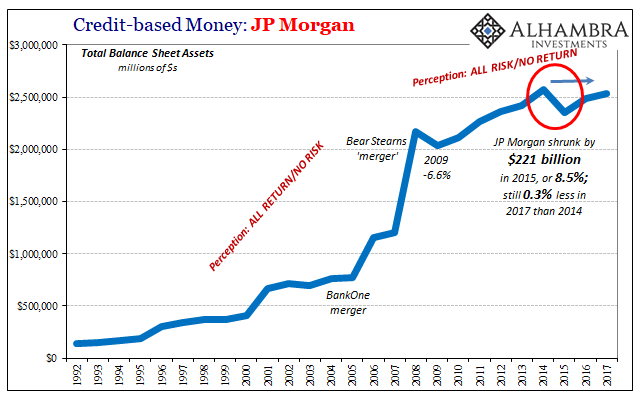
Though this overview is a broad and general assessment of bank capacity, what it says about balance sheet capacity in its monetary function within the eurodollar system isn’t good. “Reflation” aside, there isn’t any money in money, and so there isn’t an impetus for financial therefore sustained, broad-based monetary expansion. JP Morgan’s chosen characterization of itself is probably the most appropriate description of this type of essential banking – the “fortress” balance sheet.
If it and the others stick to that guiding principle, we should not expect drastic (positive) changes in global monetary conditions. There may be here and there some qualified improvements, of course, such as we saw not coincidentally toward the end of 2016 and the beginning of 2017, back when banks could make a little money in bond trading. By and large, however, there aren’t indications of inflection or anything beyond the mere relative.
Using something like TIC to corroborate, or deny, the broad balance sheet reports included with bank earnings is useful in that sense. It has become more difficult on a monthly basis, though, with estimated cross-border bank liability flows having shifted their intra-quarter pattern away from the more stable quarterly shape of the “rising dollar.”
The just-released TIC data for November in terms of bank liabilities showed a big difference to the middle month (August) of last quarter (though for the quarter as a whole it was far less different and positive).
(Click on image to enlarge)

What that might ultimately mean for Q4 as a whole isn’t yet clear. It looks far more like the “rising dollar” quarters than it does the “reflation” quarters of Q4 2016 and Q1 2017. The big jump in August last year may have had something to do with China/Hong Kong, or it may be why “reflation” kicked in a little from September forward.
(Click on image to enlarge)

We won’t know in TIC until we get December’s tally. While that will help with more detail about what happened in Q4, we already have a general idea that it won’t be very different than what we have come to expect. Foreign central banks are still selling UST’s, though to a smaller degree, suggesting general if broad tightness continues onward.
We also have a reasonable idea who remains the primary target of “tightness.” With CNY more stable rather than rising in November, and HKD only starting lower, the TIC data unsurprisingly shows selling of UST’s in mainland China (-$12.6 billion) and at the same time buying of them in Hong Kong (+$2.6 billion). Belgium’s holdings were practically unchanged (slightly down), meaning that for the three Chinese pockets TIC combined there was a little less in them consistent with CNY up to that point.
(Click on image to enlarge)

(Click on image to enlarge)

Similarly, Japan’s reported holdings of UST’s fell, too. That’s in keeping with JPY rangebound at a high of around 110 and a low of 114. During November, yen traversed from the low (which is what BoJ wants) back toward the high within that range, resulting, it appears, in another $10 billion decline in holdings.
(Click on image to enlarge)

It checks closely with other indications like other EM currencies, even oil and copper at the more appropriate longer timescale. They have all rebounded from the depths of the “rising dollar”, but not really rebounded. The monetary system still exhibits profound constraint starting from the fact the whole paradigm has shifted – what used to be considered riskless profit is now treated as profit-less risk, the fortress mentality that even at the end of 2017 endures.
(Click on image to enlarge)

Disclosure: None.


It is certainly worth watching the players as interest rates rise and if the dollar falls further. Nothing is imminent and there is not a crisis yet, however, it should be a concern. There aren't that many giant buyers who can munch the amount of debt the US is pouring on. It is dangerous to make that amount larger and the US budget as is will likely end up forcing cuts in later years that won't be that palatable.