Forex Analysis Of USD/JPY For Tuesday, August 7
First, we look into the previous day trade and what happened on August 6, 2018, and the USD/JPY pair opened at 111.214 and went high at 111.518 and gone low 111.144 and finally closed at 111.386. The calculated pivot point for the day is 111.349.
The difference between high and low was nearly 0.374 points and there was a very good chance for traders to take the opportunity between low to high levels and finally benefit.
The pair may go from low levels to resistance levels today, you should buy at the support levels and sell at the resistance levels for more profits. Four hour chart followers may consider buy at 111.481, 112.313 and sell at 110.160, 110.940 levels.
LEVELS TO BE WATCHED FOR TRADERS FOR THEIR TRADING
|
Level |
First Level |
Second Level |
Third Level |
|
Selling Level |
111.10 |
110.70 |
110.25 |
|
Buying Level |
111.35 |
111.52 |
111.76 |
EVENTS TO BE OBSERVED AT THESE TIMES TO TAKE MORE ADVANTAGE
USDJPY FUNDAMENTALS TODAY
|
GMT |
Event |
Actual |
Previous |
|---|---|---|---|
|
15:30 |
USD 3-Month Bill Auction |
2.01% |
2.00% |
|
23:30 |
JPY Overall Household Spending (YoY) |
-1.2% |
-3.9% |
|
23:50 |
JPY JP Foreign Reserves |
$1,256.3B |
$1,258.7B |
|
00:00 |
JPY Labor Cash Earnings (YoY) |
3.6% |
2.1% |
|
05:00 |
JPY Leading Economic Index |
105.2 |
106.9 |
|
05:00 |
JPY Coincident Index |
116.3 |
116.8 |
|
12:55 |
USD Redbook index (MoM) |
0.5% |
|
|
12:55 |
USD Redbook index (YoY) |
4.2% |
|
|
14:00 |
USD JOLTS Job Openings |
6.638M |
|
|
n/a |
USD IBD/TIPP Economic Optimism (MoM) |
56.4 |
|
|
15:30 |
USD 3-Year Note Auction |
2.685% |
|
|
15:30 |
USD 4-Week Bill Auction |
1.91% |
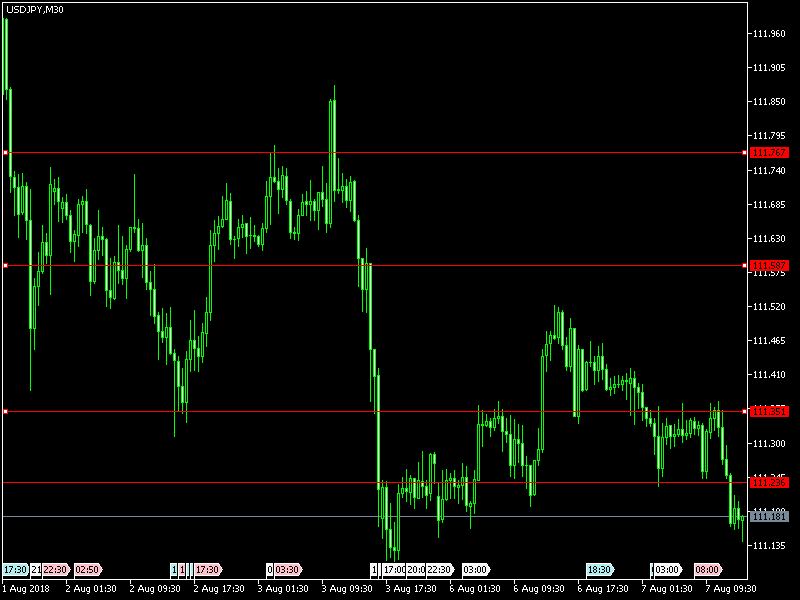
See the levels in the Chart and trade accordingly:
(Click on image to enlarge)