Forex Analysis Of GBP/USD For Thursday, August 9
First, we look into the previous day trade and what happened on August 8, 2018, and the GBP/USD pair opened at 1.29379 and went high at 1.29592 and gone to low at 1.28531 and finally closed at 1.28817. The calculated pivot point for the day is 1.28959.
The difference between high and low was nearly 0.1061 points and there was a very good chance for traders to take the opportunity and finally benefit. Now there is a new opportunity where the market is trying to go lower & recover since it is in an oversold region.
Hourly (4 hrs) chart followers and traders should go for buy at 1.28931, 1.29408 and sell at 1.28577, 1.27819 levels in order to get good profit. For a few days, the pair was ranging from 1.2964 to 1.3350 levels and started moving to lower levels from low levels due to various reasons. Traders should be cautious since it reached the oversold region.
TRADERS SHOULD OBSERVE AT THESE LEVELS FOR THEIR TRADING
|
Level |
First Level |
Second Level |
Third Level |
|
Selling Level |
1.2850 |
1.2800 |
1.2750 |
|
Buying Level |
1.3000 |
1.3050 |
1.3100 |
EVENTS TO BE OBSERVED BY TRADERS AT THESE TIMINGS AND TAKE ADVANTAGE
GBPUSD FUNDAMENTALS TODAY
|
GMT |
Event |
Previous |
|---|---|---|
|
08:00 |
EUR Economic Bulletin |
|
|
12:30 |
USD Producer Price Index (MoM) |
0.3% |
|
12:30 |
USD Producer Price Index (YoY) |
3.4% |
|
12:30 |
USD Producer Price Index ex Food & Energy (YoY) |
2.8% |
|
12:30 |
USD Producer Price Index ex Food & Energy (MoM) |
0.3% |
|
12:30 |
USD Continuing Jobless Claims |
1.724M |
|
12:30 |
USD Initial Jobless Claims |
218K |
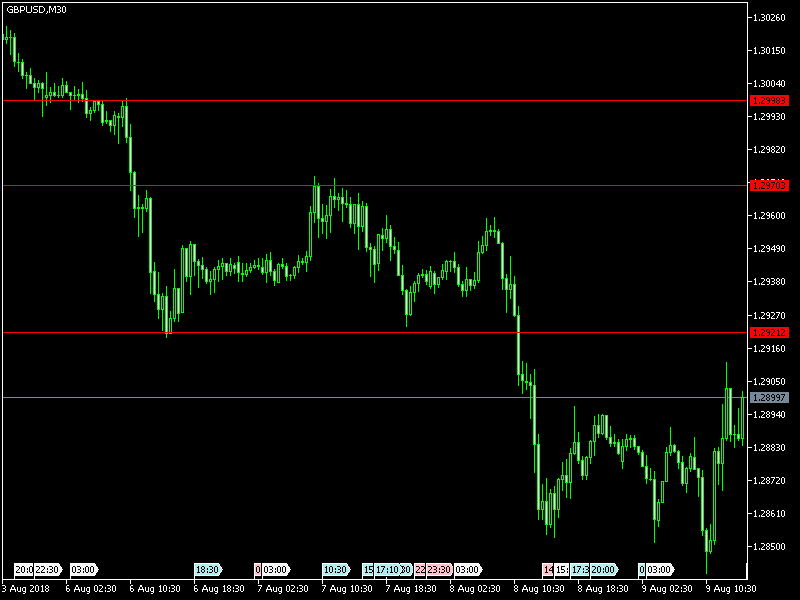
See the levels in the Chart and trade accordingly:
(Click on image to enlarge)