
Following Good Earnings, General Motors Is Top Strong Buy Upgrade
For today's edition of our upgrade list, we used our website's advanced screening functions to search for UPGRADES to BUY or STRONG BUY with complete forecast and valuation data. They are presented by one-month forecast return. General Motors (GM) is our top-rated upgrade this week and it is a STRONG BUY. China Construction Bank (CICHY) and Yanzhou Coal (YZCAY) are also STRONG BUY stocks. The other picks this week--Cai International (CAI) and Trimas Corp (TRS) are BUY-rated stocks. The Chinese companies do not include full forecast and valuation data but were included as a courtesy since there were not five upgrades to BUY or STRONG BUY with full data today.
|
Ticker |
Company Name |
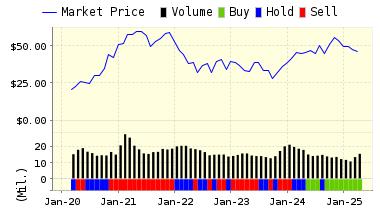
Market Price |
Valuation |
Last 12-M Return |
1-M Forecast Return |
1-Yr Forecast Return |
P/E Ratio |
Sector Name |
|
GM |
GENERAL MOTORS |
35.77 |
-8.70% |
15.42% |
1.14% |
13.71% |
5.43 |
Auto-Tires-Trucks |
|
CICHY |
CHINA CONSTR BK |
16.58 |
N/A |
23.00% |
1.09% |
13.11% |
6.24 |
Finance |
|
YZCAY |
YANZHOU COAL |
9.41 |
N/A |
55.79% |
1.08% |
13.01% |
14.70 |
Oils-Energy |
|
CAI |
CAI INTL INC |
27.03 |
-17.75% |
202.01% |
0.57% |
6.81% |
27.30 |
Transportation |
|
TRS |
TRIMAS CORP |
23.95 |
5.40% |
30.66% |
0.53% |
6.30% |
17.74 |
Industrial Products |
For today's bulletin, we take a look at our top-ranked STRONG BUY upgrade, General Motors (GM). General Motors is engaged in the designing, manufacturing and retailing of vehicles globally including passenger cars, crossover vehicles, and light trucks, sport utility vehicles, vans and other vehicles. Its business is organized into three geographically-based segments- General Motors North America (GMNA), General Motors International Operations (GMIO) and General Motors Europe (GME). General Motors Company is headquartered in Detroit, Michigan, the United States of America.
While Tesla Motors has scooped up a lot of publicity--both positive and negative--recently, the old-line auto manufacturers are far from dead. Tesla is working hard to make their goal of 25k vehicles every quarter. Meanwhile, big players like Toyota and VW can produce 25k vehicles per day.
GM has come a long way since the dark days of the Great Bush Recession, when their solvency and survival was a subject of much debate. Thanks to the Obama administration and the US Congress, the US auto manufacturing base was saved. And in the long economic expansion that has followed, the Big Three US auto makers have rebounded in a big way.
GM reported decent earnings last week for Q2 1017. GM reported second-quarter net income of $2.4 billion or $1.60 per share, down from $2.8 billion or $1.74 per share a year earlier. Excluding one-time charges, earnings per share of $1.89 beat analyst estimates of $1.69.
They beat analysts estimates for their quarterly net profit due to some effective cost cutting and they also promised to cut production moving forward and thus eliminate any issues related to stagnant inventories. GM also re-asserted their earnings outlook for 2017.
The sour notes from GM CFO Chuck Stevens included a caution to analysts that sales of the highly profitable vehicles in the large-truck category could be effected as the company brings a new generation of pick ups to market for 2018. Profits, however, are expected to remain strong as long as production remains near the current 17 million vehicles/year level.
Below is our latest data for General Motors (GM):
ValuEngine updated its recommendation from BUY to STRONG BUY for General Motors on 2017-07-28. Based on the information we have gathered and our resulting research, we feel that General Motors has the probability to OUTPERFORM average market performance for the next year. The company exhibits ATTRACTIVE P/E Ratio and Company Size.
|
ValuEngine Forecast |
||
|
Target |
Expected |
|
|---|---|---|
|
1-Month |
36.18 | 1.14% |
|
3-Month |
35.73 | -0.10% |
|
6-Month |
35.79 | 0.07% |
|
1-Year |
40.67 | 13.71% |
|
2-Year |
36.74 | 2.71% |
|
3-Year |
36.79 | 2.85% |
|
Valuation & Rankings |
|||
|
Valuation |
8.70% undervalued |
Valuation Rank(?) |
|
|
1-M Forecast Return |
1.14% |
1-M Forecast Return Rank |
|
|
12-M Return |
15.42% |
Momentum Rank(?) |
|
|
Sharpe Ratio |
0.52 |
Sharpe Ratio Rank(?) |
|
|
5-Y Avg Annual Return |
11.43% |
5-Y Avg Annual Rtn Rank |
|
|
Volatility |
22.00% |
Volatility Rank(?) |
|
|
Expected EPS Growth |
-12.14% |
EPS Growth Rank(?) |
|
|
Market Cap (billions) |
57.47 |
Size Rank |
|
|
Trailing P/E Ratio |
5.43 |
Trailing P/E Rank(?) |
|
|
Forward P/E Ratio |
6.18 |
Forward P/E Ratio Rank |
|
|
PEG Ratio |
n/a |
PEG Ratio Rank |
|
|
Price/Sales |
0.34 |
Price/Sales Rank(?) |
|
|
Market/Book |
1.44 |
Market/Book Rank(?) |
|
|
Beta |
1.48 |
Beta Rank |
|
|
Alpha |
-0.00 |
Alpha Rank |
|
Disclosure: None.


