
Federal Deficit Continues To Worsen; Repercussions – Or Lack Thereof – For 10-Year Notes
On a 12-month rolling total basis, federal deficit in August shot up to just under $900 billion. This at a time when the US economy is in expansion. In all probability, the red ink only gets worse from here. The question is, is this or not already reflected in 10-year T-notes?
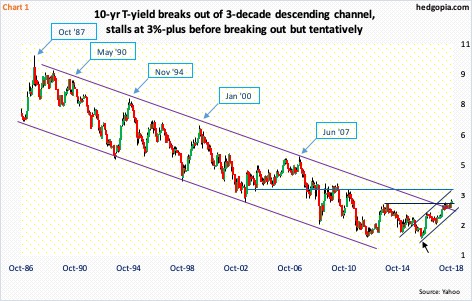
The 10-year Treasury rate (3.16 percent) has come a long way. As recently as September 2017, 10-year notes yielded 2.03 percent, and 2.81 percent on August 22 this year. Yields have come under slight pressure since reaching 3.25 percent eight sessions ago. Prior to this, early this month they broke out of the mid-May high of 3.12 percent. This resistance goes back to at least June 2003. Even before this, in April this year, the 10-year yield poked its head out of a three-decade descending channel.
Back in July 2016, the 10-year yield bottomed at 1.34 percent (arrow in Chart 1). Since then, it has made higher lows. A rising channel drawn thereof extends to 3.5-3.6 percent. There is also horizontal resistance at that level. In a perfect scenario for bond bears, yields may have room to test that level. How things evolve will depend a lot on what is in the price already. These notes have had their share of decline for over two years now. Fundamentally, one of the variables bond bears reliably cite for their negative bias is government deficit.
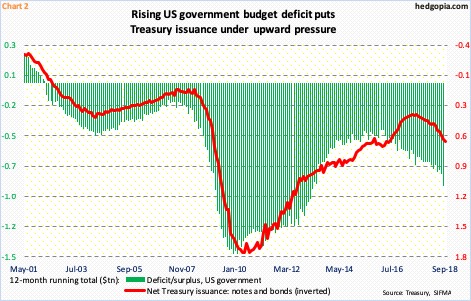
Great Recession ended in June 2009. The US economy has been in recovery/expansion mode since. That is nine-plus years. During all this, the federal government ran a budget deficit. In fact, on a 12-month rolling total basis the last time it had a surplus was in March 2002 (Chart 2).
More importantly, the budget trend is worsening. In January 2016, the deficit was $403.6 billion. This August, this had more than doubled, to $890.2 billion. Not surprisingly, issuance of Treasury notes and bonds has followed suit. In September, once again on a rolling 12-month basis, issuance was $602 billion, up from $335 billion from July 2017.
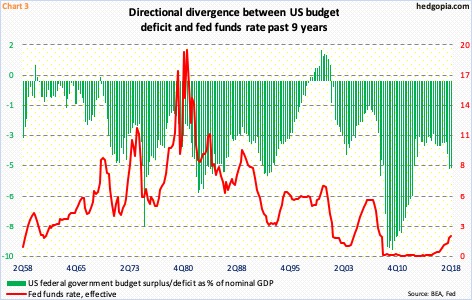
One way of measuring whether or not the deficit is getting to be excessive is by simply calculating it as a percent of nominal GDP. In 2Q18, the difference between federal receipts and expenditures – minus $982.5 billion, seasonally adjusted annual rate – made up 4.8 percent of GDP ($20.4 trillion). The green bars in Chart 3 have persistently risen since reaching a multi-year low of three percent in 4Q15.
Incidentally, the fed funds rate tends to move with the green bars. This relationship has been broken for nearly a decade now. The Fed left the benchmark rate at/near zero beginning 4Q08, even as the green bars began to shrink. Interest rates only began to rise in December 2015, but by then the deficit picture was on its way to deteriorating.
The thing is, in all probability, this will only get worse in the quarters/years to come. Last December’s tax cuts, followed by fiscal stimulus, will come at a cost. This is already happening.
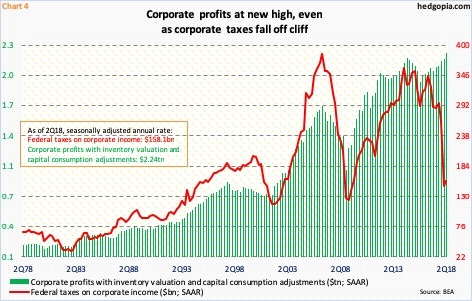
Chart 3 plots US corporate profits with inventory valuation and capital consumption adjustments against federal taxes on corporate income. In normal circumstances, they tend to move in sync. But once again this relationship is in divergence.
In 2Q18, this measure of corporate profits came in at $2.24 trillion – a new record. Federal taxes on corporate income, however, was $158.1 billion in the quarter, down from $264.4 billion in 4Q17. The Tax Cuts and Jobs Act of 2017 was passed into law last December.
The question is if this deterioration – in both budget deficit and taxes collected – is in the price of 10-year notes. Federal deficit has been with bond vigilantes for a while, so it could very well be in the price. The drop in corporate taxes is relatively new, so it may or may not be. We will soon find out. How the 10-year behaves around here, particularly if it manages to test the aforementioned resistance at 3.5-3.6 percent, will be telling. For now, nearest support lies at 3.12 percent.
Disclaimer: This article is not intended to be, nor shall it be construed as, investment advice. Neither the information nor any opinion expressed here constitutes an offer to buy or sell any ...
more

