
Fed Tightening Cycles
Last December the Fed began what it thought at the time was a new cycle of tightening. Fed Chair Janet Yellen’s statements last week suggest the Fed still sees this plan as underway. A comparison with historical tightening cycles sheds some light on why so far the Fed hasn’t followed through.
The graph below plots the fed funds rate over the last 30 years and highlights 4 historical tightening episodes in 1988, 1994, 1999, and 2005. The fed funds rate went up by 300 basis points on average in these episodes within the space of one or two years.
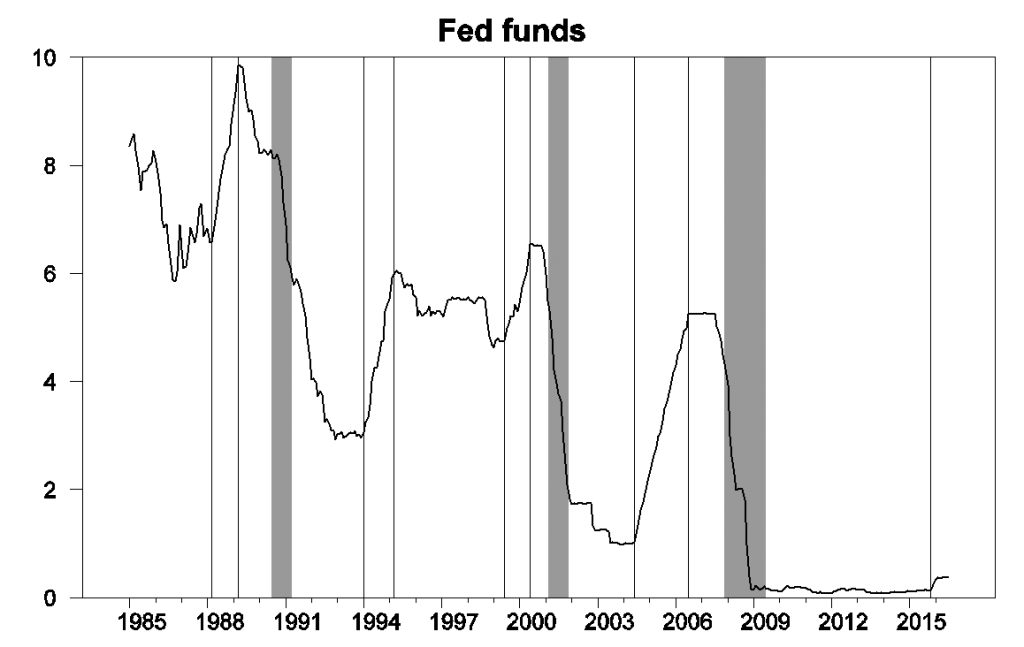
Monthly average of effective fed funds rate, Jan 1985 to July 2016. Shaded regions denote NBER recessions and vertical lines drawn at 1988:3, 1989:3, 1994:1, 1995:3, 1999:6, 2000:6, 2004:6, 2006:7, and 2015:11.
These 4 episodes have several things in common. First the inflation rate rose during each of these episodes and was on average above the Fed’s 2% target, a key reason the Fed moved as it did. Second, the unemployment rate declined during each of these episodes and ended below the Congressional Budget Office estimate of the natural rate of unemployment, again consistent with an economy that was starting to overheat. Third, the nominal interest rate on a 10-year Treasury security rose during each of these episodes, consistent with an expanding economy and rising aggregate demand.
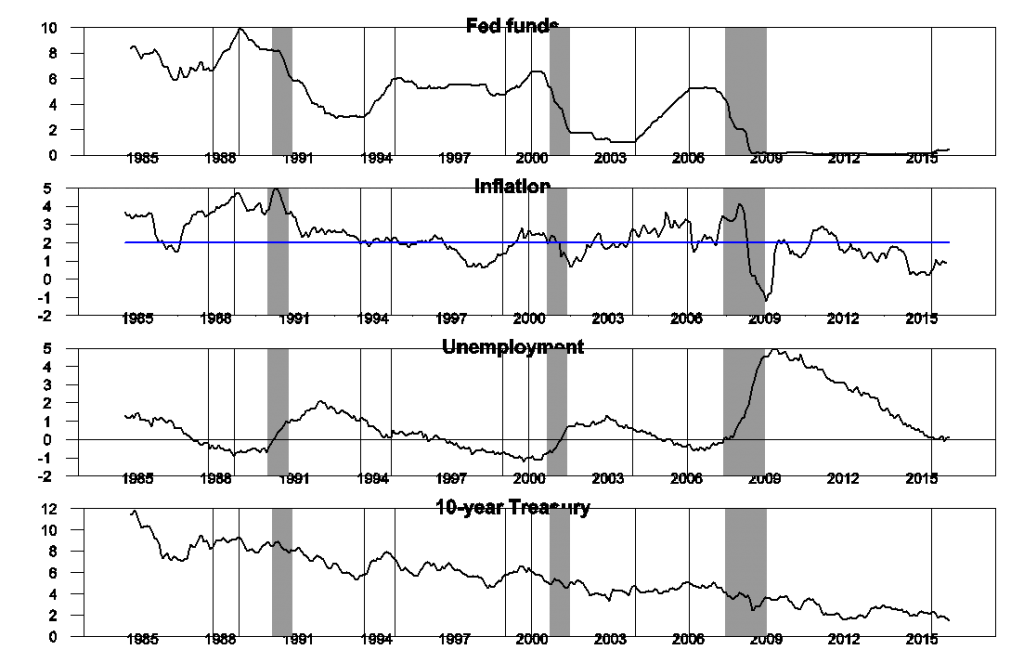
Top panel: effective fed funds rate, Jan 1985 to July 2016. Second panel: Annual inflation rate as measured by the 12-month change in the natural logarithm of the monthly PCE price deflator, with blue line indicating 2%. Third panel: difference between unemployment rate and CBO estimate of natural unemployment rate. Fourth panel: Interest rate on 10-year Treasury bond.
The FOMC anticipated in December that it would implement 4 more rate hikes in 2016 and another 4 in 2017, a bit slower than the typical tightening cycle highlighted above, but a clear tightening cycle nonetheless. So far they have implemented zero increases beyond the first modest move in December.
|
episode |
fed funds |
inflation |
unemployment |
10-year yield |
|
1988:3-1989:3 |
3.27 |
1.00 |
-0.70 |
0.99 |
|
1994:1-1995:3 |
2.93 |
0.17 |
-1.20 |
1.45 |
|
1999:6-2000:6 |
1.77 |
1.24 |
-0.30 |
0.20 |
|
2004:6-2006:7 |
4.21 |
0.42 |
-0.90 |
0.36 |
|
Average |
3.05 |
0.71 |
-0.78 |
0.75 |
|
2015:11-2016:6 |
0.26 |
0.43 |
-0.10 |
-0.62 |
But in several other respects this isn’t shaping up like the earlier cycles. Inflation is a little higher than it was last year, but is still a full percentage point below the level that the Fed says it would like to see. The unemployment rate has barely budged, and has not yet moved below the CBO estimate of the natural rate. And most revealing of all, the long-term interest rate has fallen dramatically, completely unlike the behavior in a typical Fed tightening cycle.
The Fed may be anticipating solid growth, but so far the bond market doesn’t seem to be. There’s really no evidence yet that inflation needs to be contained or that we should slow down the labor market. If all three of those indicators– inflation, unemployment, and long-term rates– were sending a positive signal, then I’d be all on board for going ahead. But when none of the three are, it makes more sense to keep the plan on hold for now.
Disclosure: None.


The issue with consistently low rates is it breeds unintended consequences. Some of the main ones are absurd asset price valuations which leads to absurd and unsustainable housing price rises that slow the economy not encourage it, low capital investment, misallocation of capital and resources, cash hoarding, and decreased investment income.
There are a lot more reasons to raise rates than just inflation. But onto inflation, if housing, oil, and medical expenses weren't nerfed than inflation would be much higher than it is officially. It is time to get an independent agency to measure these since the government's numbers are toyed with to make things appear as they want and not as they are.