
Eye Opening Index, Volatility, Charts And Predictions
Volatility setting up like 2014/2015, get ready for some interesting range rotation and price swings.
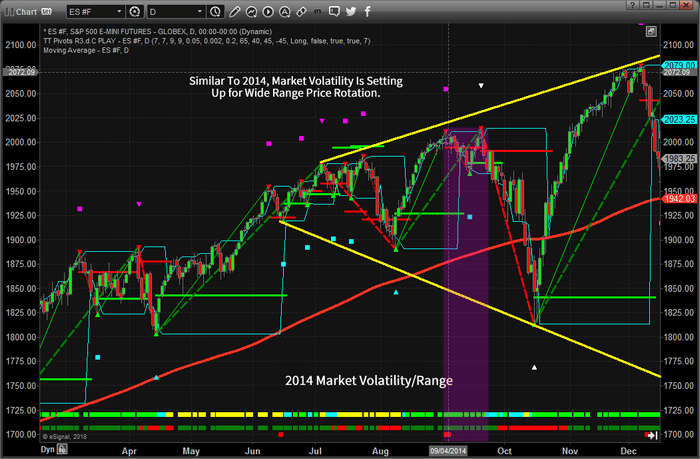
Our recent research shows that the current US markets are setting up for what could become a very interesting price range rotation as well as increased volatility.
Let us take a look at the 2014 price activity first.You may not be able to see the similarities like our team of researchers, and I will confess, these charts have a lot of analysis on them making it a little noisy and hard to sort through, but if you focus on the September 2014 date range, you may notice a similarity to right now in the use markets (primarily the NQ). The focus of this article is to alert you that the market dynamics are evolving quickly and you need to stay aware of the changes as they happen. There is a huge amount of capital at play in the US markets.
(Click on image to enlarge)
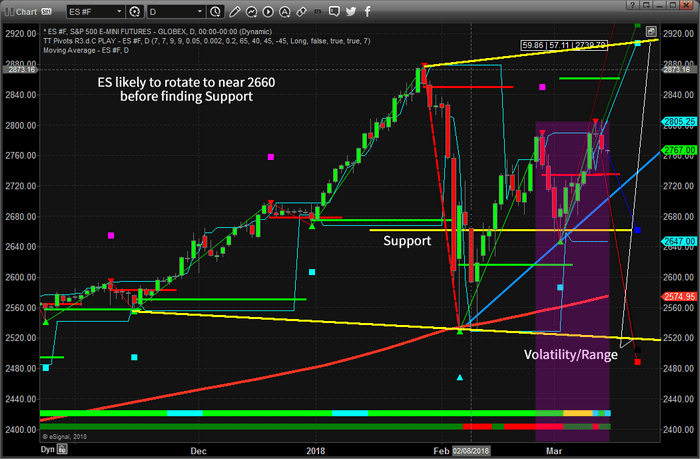
This next chart shows us the ES (S&P) chart as of today.It is clearly a different setup from the 2014 price setup – but still similar enough for our modeling systems to catch this event. The volatility range of price is increasing in a sideways channel. This could be a good thing for traders like us. The volatility could present some real issues for trend followers like Hedge Funds and other modeling systems as they are not likely to see this price pattern setting up.
We believe the ES will rotate lower over the next few days to attempt to retest support near 2660 before attempting another short rally likely ending near, or just above 2800. This would represent a failed price rotation with a new double top or higher high price level very similar to the second top near the end of September 2014. We believe this second top could produce another deeper dive in prices sometime in early April 2018.Still, the 2660 level is support and we would have to be cautious near those levels.
(Click on image to enlarge)
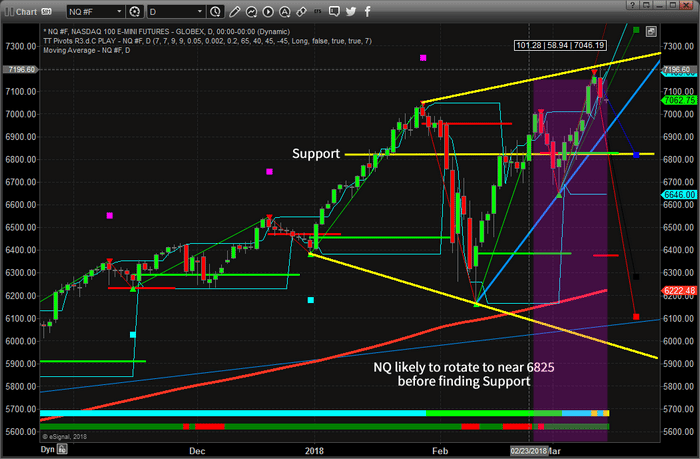
This next chart is the NQ (Nasdaq) and is showing a pattern that is much more similar to the 2014 ES chart. Support at 6820 is our critical price level and we are expecting a downside market price move immediately to retest this level as well as the upward price channel (in light blue). You can see the range expansion levels drawn in YELLOW and if you study this price rotation to the 2014 price chart, you’ll see some strange similarities.
What is happening is that price is lacking direction and is attempting to hammer out peaks and valleys in an attempt to find support and resistance. The chance of a deeper price move as well as increased volatility is quite high the further this pattern continue to form. Any price move lower will likely cause the VIX to increase back above 20 and any price swing below 6600 on the NQ will likely cause the VIX to spike well above 25 again. As you can see, the downside price volatility range is near 5900.
(Click on image to enlarge)
In fact, we called this rally nearly to the day over a month ago completing the bullish outlook portion. Now, the question is if our current analysis and our 6-week old prediction are correct with a big sell-off.
(Click on image to enlarge)
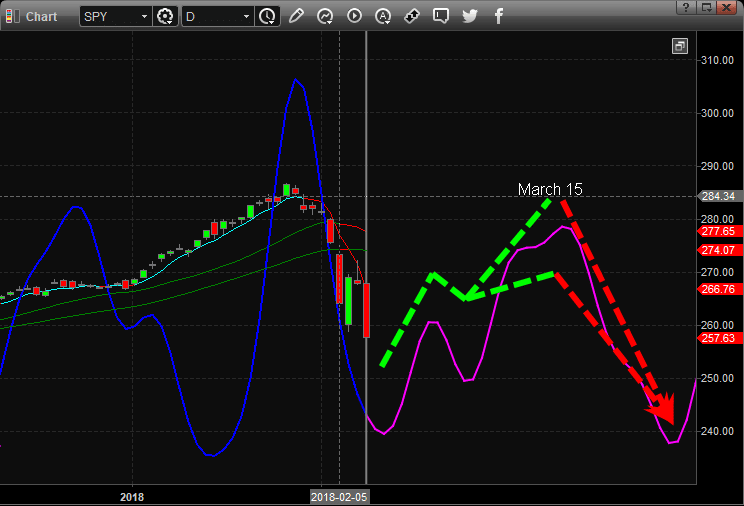
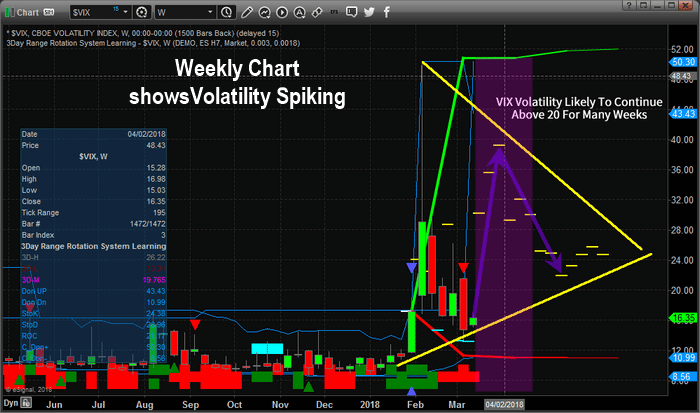
Our Adaptive Dynamic Learning (ADL) price modeling system is showing the VIX is setting up for a massive increase over the next two to three weeks. VIX is currently trading near 16 and could spike to as high as 40 within just a few weeks. The only way the VIX could attempt a move like this is with a moderately deep downward price move that would take out or test our support levels.
This could set us up for a good short volatility trade much like the last one in Feb where we shorted UVXY for a quick 42.5% profit.
(Click on image to enlarge)
Disclosure: If you want to know where the market is headed each day and week, well in advance then be sure to join my Pre-Market Video Forecasting service which is: more


