
Exploring Inequality: Real Wages And Productivity Growth
by Philip Pilkington
I recently had an argument with a few New Keynesian types in the comments section of Lars Syll’s blog. I won’t get into the nuances here as they are not very interesting. Basically, the New Keynesians were trying to defend the idea that, in the long-run, wages are indeed flexible. The argument went nowhere partially, I think, because they misunderstood what the phrase “wages are flexible in the long-run” means.

To me that means that wages are both flexible in the sense that they will clear labour markets in the long-run (i.e. in the long-run there will be full employment so long as the correct level of interest rates is maintained in line with some Taylor Rule, as New Keynesian theory states) and it also means that wages adjust in line with the marginal productivity of labour.
You cannot really prove either of the above (dubious) assumptions with recourse to data. They are strictly a priori assertions, articles of the faith and any attempt to prove them empirically will run into unavoidable problems. Anyway, one of my interlocutors suggested that you could (and then added the caveat that you probably couldn’t) by looking at real hourly wages and real hourly output per worker.
Anyway, I decided to crunch the numbers to see what we would find. After some messing around with nominal wage growth rates my interlocutor pointed me toward real wage growth measure. The results do not say much for the idea that hourly work is compensated in line with hourly productivity. I broke the growth rates down into 8 year periods (because the data starts in 1965 and, as everyone knows, real wages started to stagnate in 1973) and here is what I found:
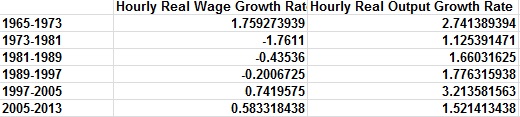
Or, to give you the same data in graph form:
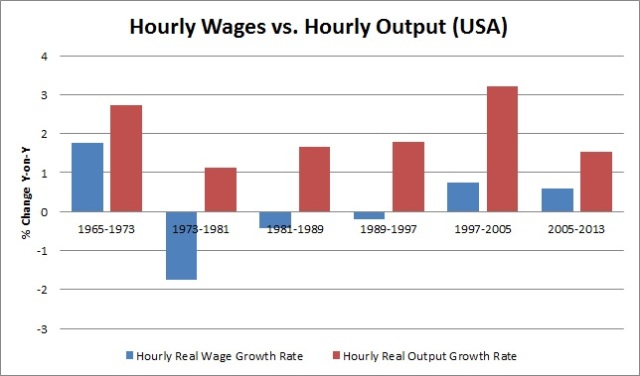
As we can see there is certainly no linear relationship here. In 1965-1973 wages and productivity chugged along nicely but after this productivity continued rising while wages stagnated. Only during the Clinton boom era (here included in the 1997-2005 aggregation) did wages actually start growing again but these were far slower relative to productivity than in the 1965-1973 era.
Marginalists can avoid this data in any number of different ways by engaging in sophistical arguments. But the fact of the matter stands: trying to explain wages by appealing to productivity measures is extremely problematic. In a world where worker bargaining power is strong, we may well see wage gains keep up with productivity but this is not due to some sort of market distributing resources in line with marginal productivities. Rather it is due to unions — probably being advised by economists who are tracking productivity growth — pushing for their living standards to keep pace.
Many economists today, in the post-Piketty world, are interested in inequality. (Economists are generally shallow types with watery convictions who want to bandwagon on every trend that comes their way). But they are also unwilling and unable to drop the stupid assumptions that were spoon-fed to them in university. They will try to bend these assumptions in all manner of different ways but, at the end of the day, they are just not up to discussing inequality in any rational or, dare I say, productive manner.
Update: This post was, as I indicated, partially a response to someone on Lars Syll’s blog. His name is Pontus and I had already told him quite clearly that he needed to dis-aggregate the data to get an idea of how wages and productivity are related. What followed was a rather nice illustration of bad data analysis. In the original comment I wrote:
Your regression results are spurious because you used too long a time period. Divide it up into six 8 year periods and you will get different results for each time period. This will suggest that you do not find a linear relationship and the relationship between wages and productivity is to be explained by some basket of confounding variables (to find out which ones, close Eviews and open a history book).
I thought that this was pretty clear. I quite clearly stated that if he divided up the data into six different time periods he would “get different results for each time period”. Pontus instead divided the data up into six time periods and ran a regression on these six datapoints.
In effect, he lessened the number of observations and then re-ran a regression he had already run. Why did he do this? What did he think he was proving? I’m not altogether sure. From the comments below it appears that he thought I was trying to “trick” him into getting worse results through using less datapoints. (That wouldn’t be much of a trick if you ask me).
So, what did I mean? Well, why not quote Keynes here in his critique of Tinbergen’s econometric study?
Put broadly, the most important condition is that the environment in all relevant respects, other than the fluctuations in those factors of which we take particular account, should be uniform and homogeneous over a period of time. We cannot be sure that such conditions will persist in the future, even if we find them in the past. But if we find them in the past, we have at any rate some basis for an inductive argument. The first step, therefore, is to break up the period under examination into a series of sub-periods, with a view to discovering whether the results of applying our method to the various sub-periods taken separately are reasonably uniform. (Professor Tinbergen’s Method, pp566-567)
So, how is this quote relevant to our present discussion? Well, the original argument was whether there was some sort of law-like relationship between wage growth and productivity growth. This is what a regression study should try to prove (or disprove). But, as Keynes implies, you cannot simply pile the data into a blender and then smugly read off the R-squared. Well, you can get away with this in the journals but they are void of any real empirics.
Rather you have to reorganise the data in line with your specific argument and then lay it out. That is what I did above. I said clearly that it was well-known that the wage growth: productivity growth ratio was far closer together in the period 1965-1973 than it was afterwards. This suggested that something else (a confounding series of variables, to use statistics-speak) was causing their divergence in the other time periods. What’s more this something else must have been having enormous effects in different time periods because the two rates diverged so sharply. You can see this extremely clearly in the graph below that reproduces the first graph but puts in another indicator that shows the divergence of the wage rate and the productivity rate from one another.

As we can see, in the periods 1965-1973 the rates only diverged by about 1% while in 1973-1981 and 1997-2005 they diverged by 2.5-3.0%.
In economics, if we want to make a meaningful causal argument we must be able to establish, as Keynes said, whether “various sub-periods taken separately are reasonably uniform”. If they are we can make a strong causal argument about the relationship (in this case that wages are set largely in line with productivity). But if they are not we can tell pretty much instantly that we are missing a key part of the story.
Anyway, the above confusions speak loudly to the problems with econometrics that Syll and I often highlight on our blogs. Most economists are not very good at establishing causal arguments and use advanced statistical methods as a crutch on which to prop up their flimsy arguments.
Update II: There were some problems with the new graph. This is a sometimes counterintuitive argument to make with data. All is fixed now. For real this time.
Update III: One final note before I’m done with this. What was the correlation that Pontus was picking up in his original regression? Why is it that wages do move to some extent with productivity? The answer to that is rather simple. It is because both wages and a certain measure of productivity are very strongly correlated to another variable. No prizes for guessing what: yep that’s right… Real GDP.
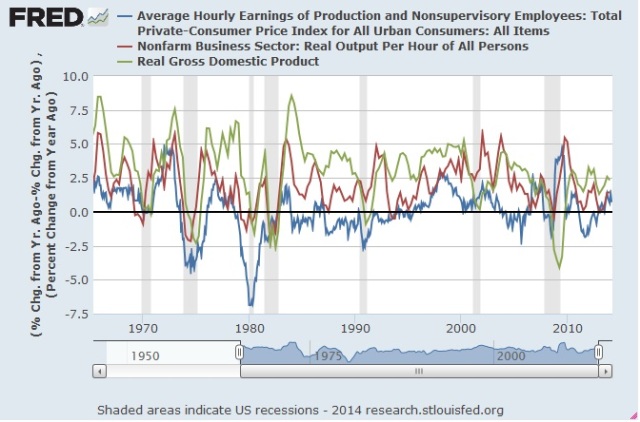
There was some divergence after 1980 but this is due to the ensuing relatively high unemployment years and we shall not discuss this here.
Disclaimer: No content is to be construed as investment advise and all content is provided for informational purposes only. The reader is solely responsible for determining whether any ...
more

