
Explaining The Demand For Higher Beta Stocks
The Capital Asset Pricing Model (CAPM) indicates returns should go up linearly as beta increases (in other words, risk and return are positively related). However, as I’ve previously discussed, the historical evidence demonstrates that, while the slope of the security market line is generally positive (higher-beta stocks provide higher returns than low-beta stocks), it is flatter than the CAPM suggests. Importantly, the quintile of stocks with the highest beta meaningfully underperform the stocks in the lowest-beta quintile in both U.S. and international markets. The highest-beta stocks provide the lowest returns while experiencing much higher volatility. This runs counter to economic theory, which predicts that higher expected risk is compensated with a higher expected return.
Susan E. K. Christoffersen and Mikhail Simutin contribute to the literature with their study, “On the Demand for High-Beta Stocks: Evidence from Mutual Funds,” which appears in the August 2017 issue of The Review of Financial Studies. They examined whether external benchmarking pressures from sponsors of defined contribution (DC) plans would lead mutual fund managers to alter their behavior when they know their place on the sponsor’s menu depends on outperforming a benchmark. Their main premise was that “managers with a larger portion of sponsor-controlled assets in their funds are more sensitive to the benchmarking criteria and therefore more apt to change their behavior to beat benchmarks.”
Are Defined Contribution Plans Sensitive to Tracking Error?
Christoffersen and Simutin also hypothesized that DC plan sponsors are sensitive to tracking error as well. Funds in DC plans that increase their exposure to higher-beta stocks would also increase their risk of tracking error (that is, having their performance excessively deviate from the benchmark). Thus, fund managers would act strategically so as to maintain a low variance around benchmark returns.
The authors write:
One strategy that high-DC funds might pursue, on average, is to ensure that betas of their portfolios fall within a narrow range just above one.
This would also allow them to avoid the aforementioned high-beta anomaly (in which the highest-beta stocks have the worst returns). Their dataset included DC funds that report their retirement holdings to Pensions & Investments and covered the period from 2003 to 2013. Christoffersen and Simutin placed stocks into three buckets: low, medium and high beta.
The following is a summary of their findings:
- Funds with a larger portion of DC assets hold higher-beta stocks. An increase in DC assets is associated with a statistically significant increase in future fund betas.
- Funds increase their holdings of high-beta stocks while decreasing their exposure to low-beta stocks, consistent with a manager attempting to beat a benchmark.
- A fund’s market beta and its holdings beta monotonically increase with the fraction of DC money, increasing from 1.03 to 1.12 in fund market beta and from 1.07 to 1.16 in fund holdings beta when comparing the lowest and highest quintiles of DC assets. This increase in exposure to market risk does not arise because the manager takes on more leverage and/or shifts the portfolio from cash into equity.
- Higher betas correspond to better future performance relative to a style benchmark. A one-standard-deviation increase of 0.26 in fund beta increases relative performance by 57 basis points per year. Tilting the portfolio to high-beta stocks thus appears to be an effective strategy for improving fund performance relative to a benchmark, although it does not improve risk-adjusted returns relative to the benchmark. And the higher-than-benchmark returns lead to higher fund inflows.
Other Findings and Considerations
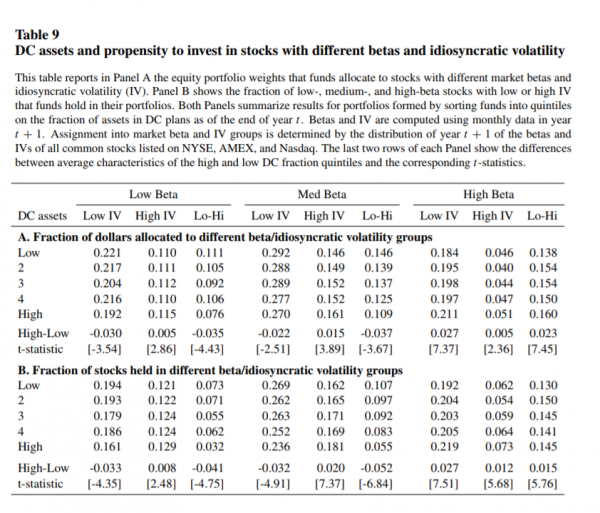
In considering the results, it’s important to note that Christoffersen and Simutin broke down stocks into just three beta buckets, not the five typically used in academic research on the subject. Thus, this could help explain why higher beta exposure led to higher returns (the table from the study highlighting the analysis is below).
(Click on image to enlarge)
The results are hypothetical results and are NOT an indicator of future results and do NOT represent returns that any investor actually attained. Indexes are unmanaged, do not reflect management or trading fees, and one cannot invest directly in an index.
Remember, the security line is not flat, but slightly upward sloping, except for the highest-beta quintiles. Thus, it seems likely that fund managers were able to outperform benchmarks by reducing their exposure to the very lowest-beta stocks while also avoiding stocks from the highest-beta quintile. Together, these two actions allowed them to achieve higher portfolio beta and higher returns.
Another possible explanation is that the sample period the authors examined is relatively short, and in that time the relation between beta and returns was more consistent with theory than on average. This was the case from 2003 through 2013. As we moved from stocks in the low-beta quintile to stocks in the high-beta quintile, returns basically increased and the highest-beta stocks had by far the highest returns: 8.8 percent, 12.4 percent, 12.2 percent, 15.2 percent and 17.9 percent per year.
Christoffersen and Simutin also found that an increase in DC assets results in an increase in subsequent R-squared measures of passiveness, such as active share (a rising R-squared figure is a decrease in active share).
They concluded:
On all accounts, it appears that managers are strategically increasing beta exposure while maintaining and even reducing the volatility of returns around the benchmark.
Thus, the total risk of the fund increases with DC assets, although the variation in returns around the benchmark decreases. This strategy allows mutual funds to earn higher-than-benchmark returns while avoiding high-beta anomaly stocks that lower returns while also increasing risk and tracking error.
The authors’ findings are important because they help explain why the securities line is flatter than the CAPM predicts (lower-beta stocks have higher risk-adjusted returns) — the demand for higher-beta stocks increases their price and lowers futures returns.
Join thousands of other readers and subscribe to our blog.
Disclaimer: Please remember that past performance is not an indicator of ...
more

