
Expect Q3 Earnings Price Surprises
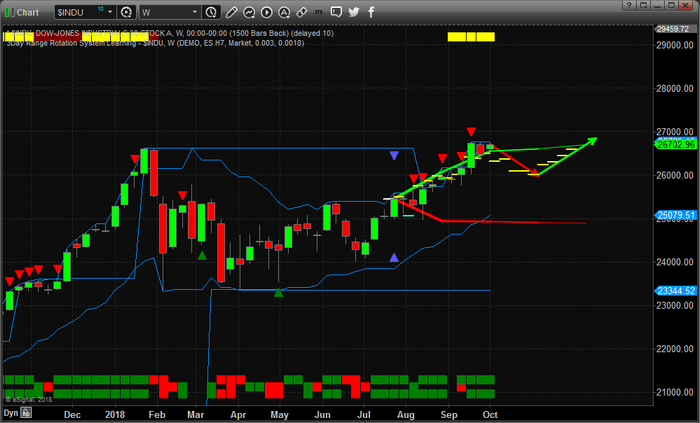
The weekly DJI (Dow Industrial Average) chart shows our Adaptive Predictive Learning (ADL) modeling system at work. In this example, we asked our ADL system what it believed would be the most likely outcome originating from July 23, 2018. The reason we selected this date is because this weekly price bar prompted the current upside price move.
This type of price trigger can often generate highly accurate future predictive price data. This bar consisted of 11 unique price markers that predict future price moves, first lower, then back to the upside, with a range of probability from 83% to 96%. The initial downside price move suggests that an initial -800 to -1000 pt move (-4%) will take place before November 10, 2018. Subsequently, price should begin to move upward again after the US mid-term elections and through the end of 2018.
In conclusion, October is known as a weak month for US equities so get ready for price volatility and expect the Tech-heavy Nasdaq to rotate in a larger range than the S&P and the DJIA. Additionally, expect the VIX to increase in value over the next 30+ days as October passes.
I will admit the charts in July/Early September were showing signs of a market correction in mind September but no bearish reversal pattern formed and price continued higher. During this time we closed out a position in YINN for 14% profit and another 4.3% in the IYT ETF. This goes to show how we can profit to the long side even when we are expecting a sell off the markets.
Disclosure: If you want to know where the market is headed each day and week, well in advance then be sure to join my Pre-Market Video Forecasting service which is more


