
EUR/USD Reaches 1.10 Round Level In Bearish ABC Zigzag
EUR/USD
4 hour

The EUR/USD made one more bearish push to reach the 50% Fibonacci level of wave D vs B and psychological round level of 1.10. A bullish 4 hour candle has appeared since price hit the 1.10 level, which could indicate that a wave A (green) has been completed. In that case an ABC zigzag (green) could occur. If price breaks the 1.10 support then a continuation of wave A (green) seems to be taking place (see 1 hour chart).
1 hour
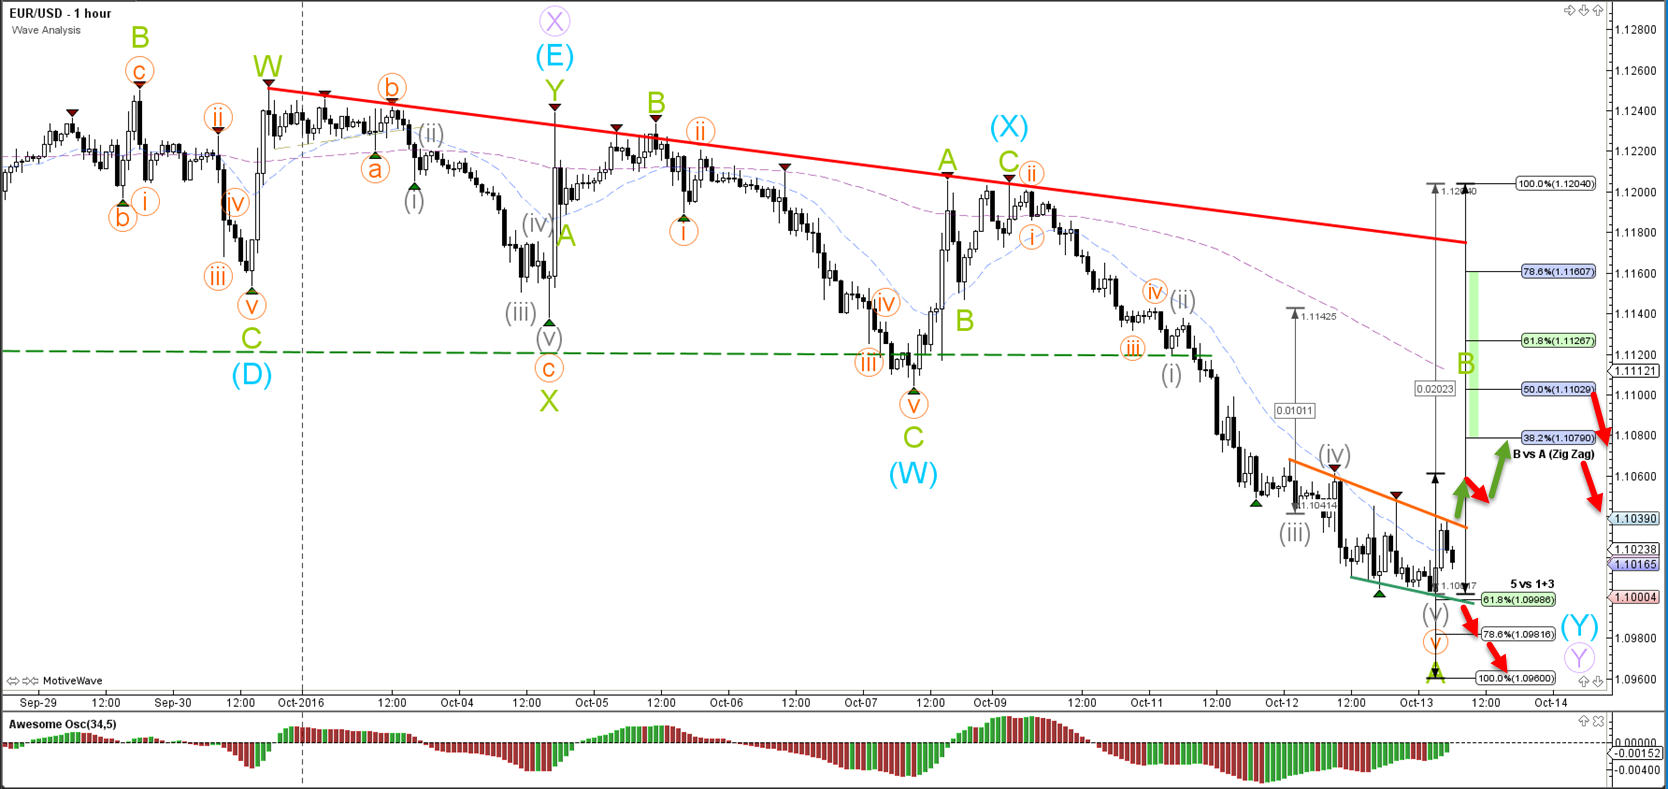
The EUR/USD break below 1.10 could see price fall towards 1.0960-50 as part of a choppy wave 5 (orange/grey) whereas a break above resistance (orange) could start wave B (green).
GBP/USD
4 hour
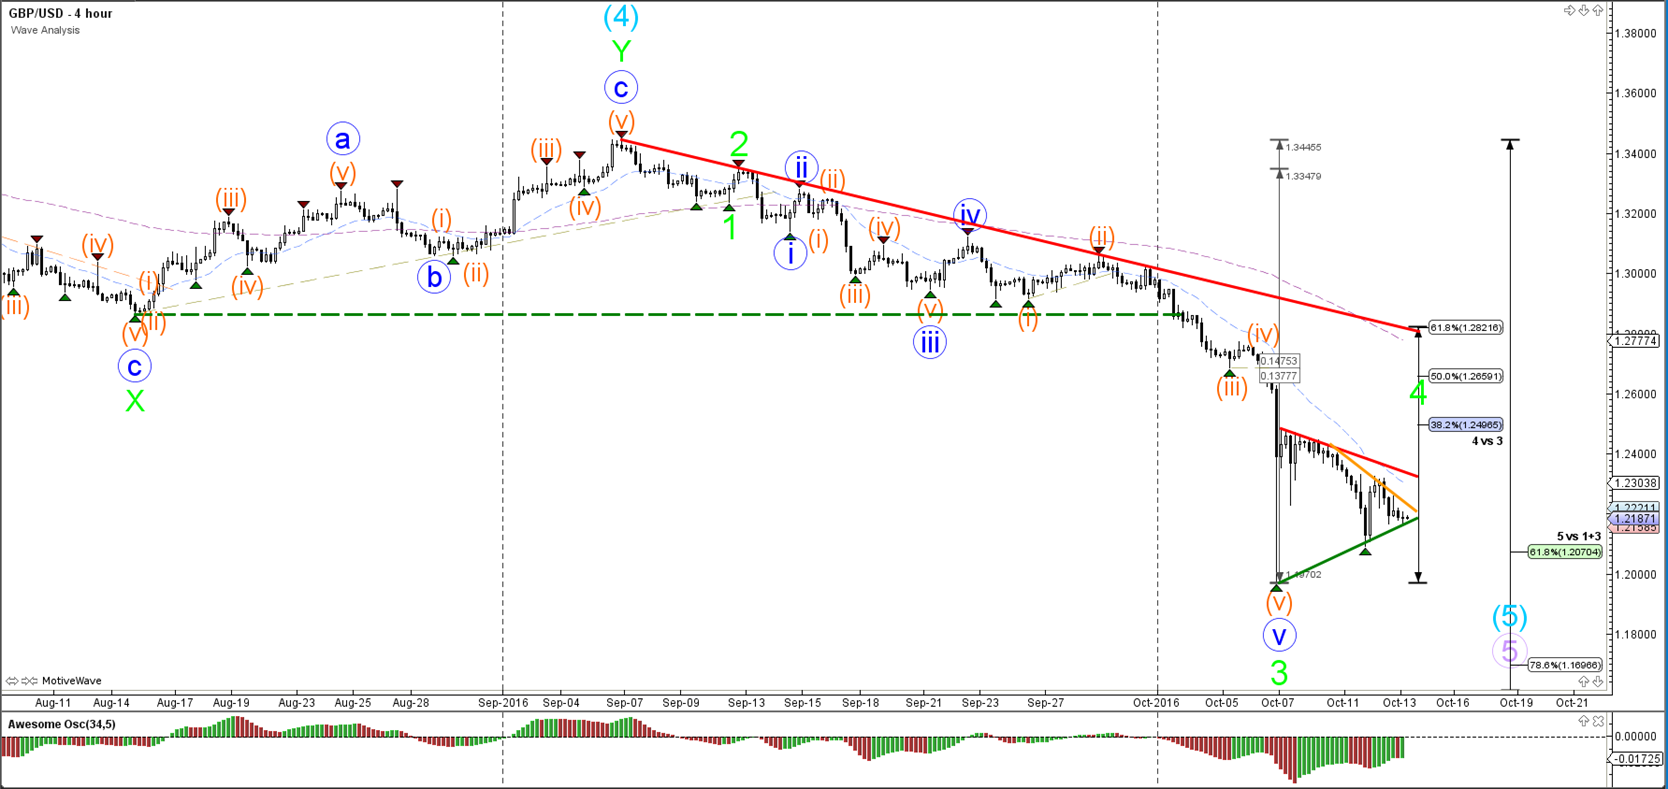
The GBP/USD continues to build a triangle formation within a wave 4 (green) after the huge 1,000 pip decline last week as part of wave 3 (green).
1 hour
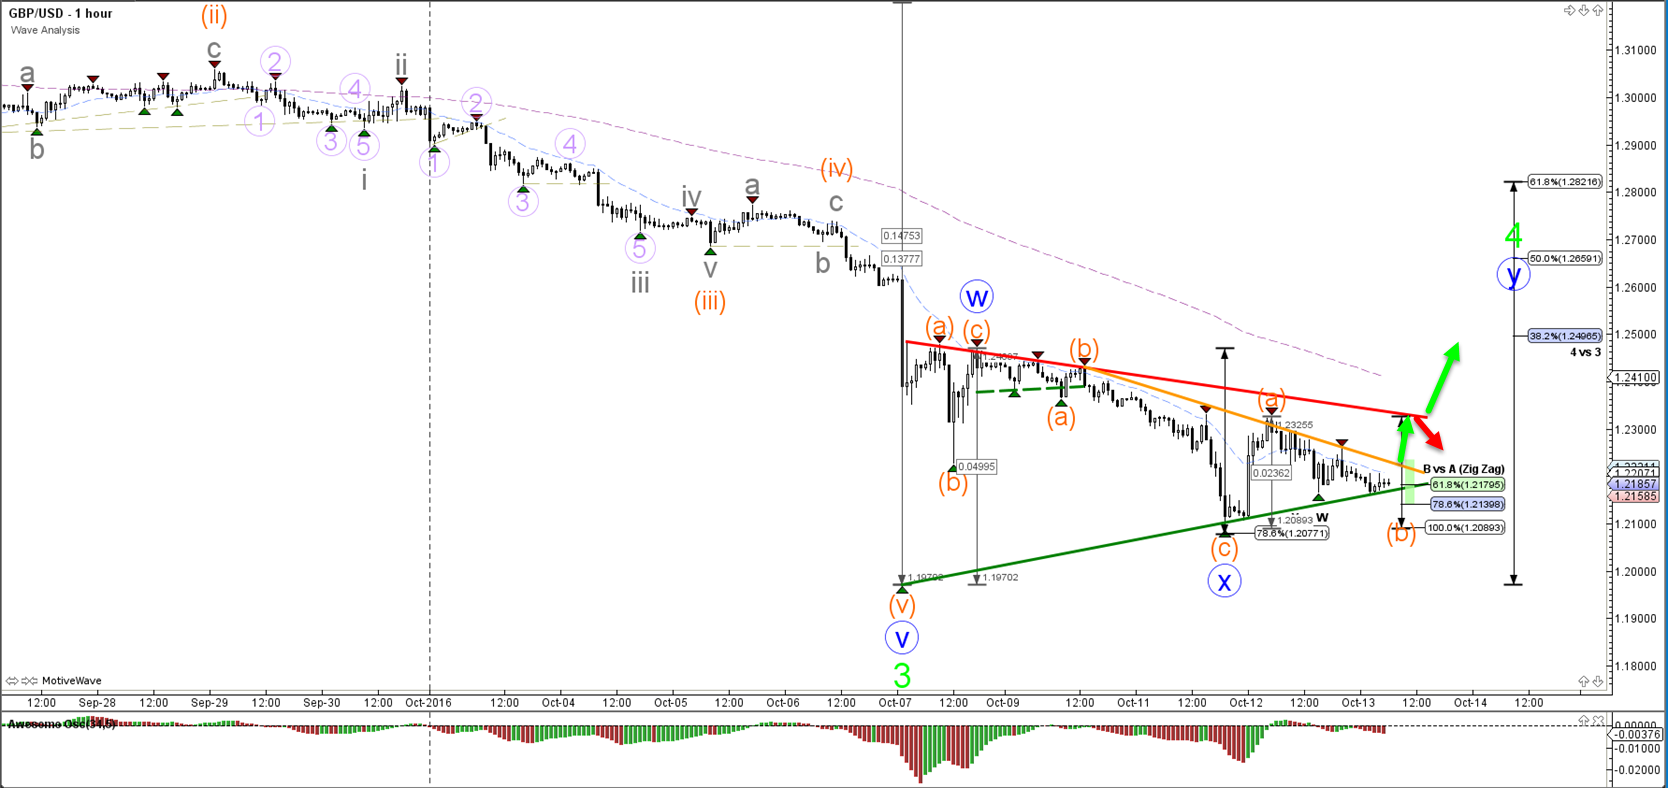
The GBP/USD completed the wave A (orange) and now seems to be retracing as part of a wave B (orange).
USD/JPY
4 hour
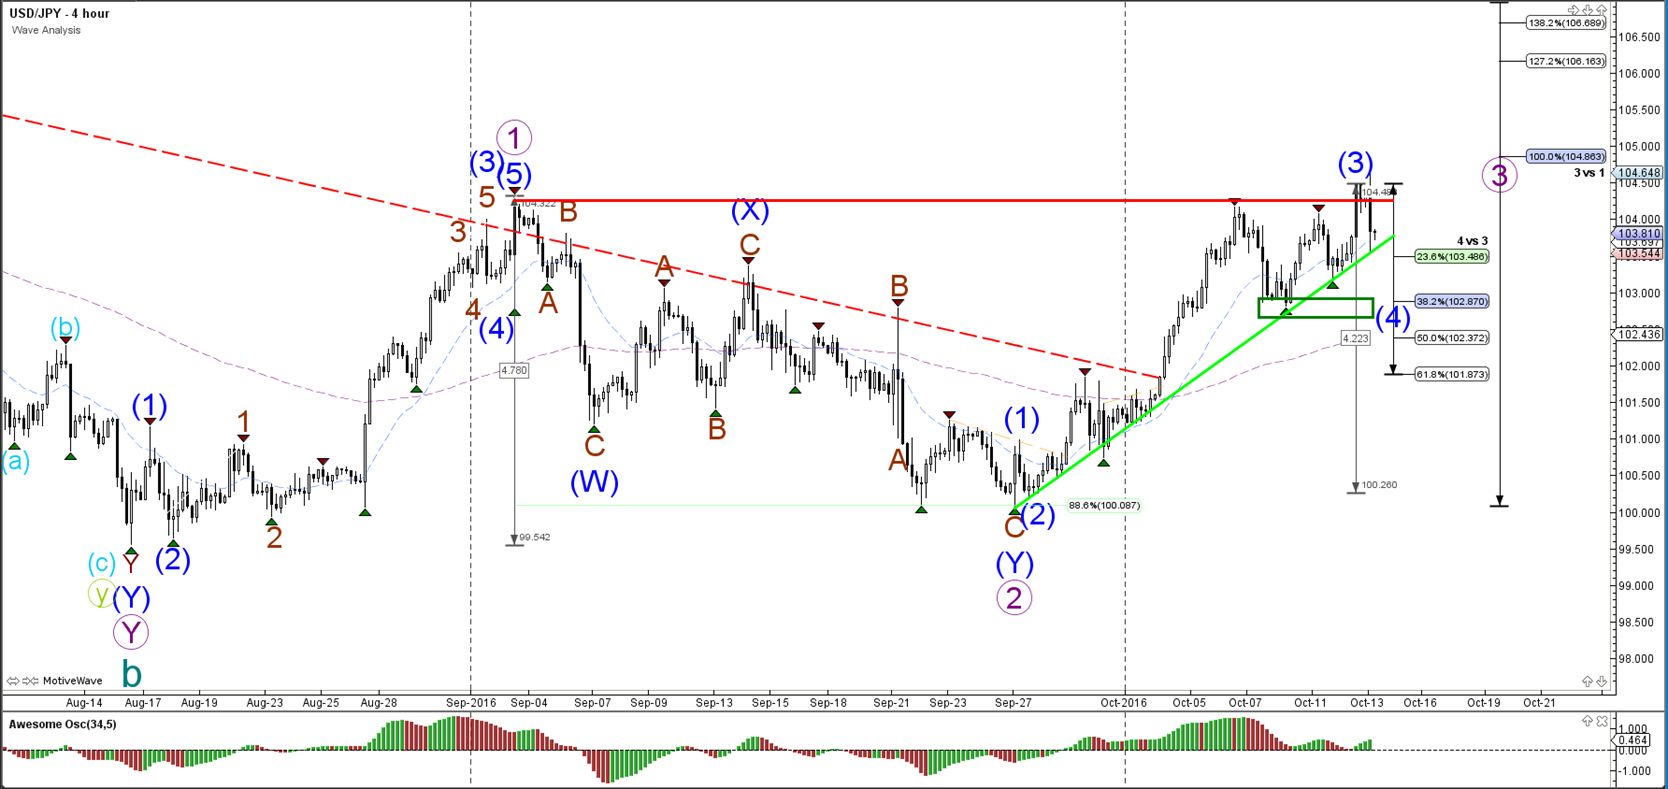
The USD/JPY challenged the previous resistance but still has not managed to break above the horizontal resistance of wave 1 (purple). For the moment it seems likely that price is building a smaller retracement within wave 4 (blue).
1 hour
(Click on image to enlarge)
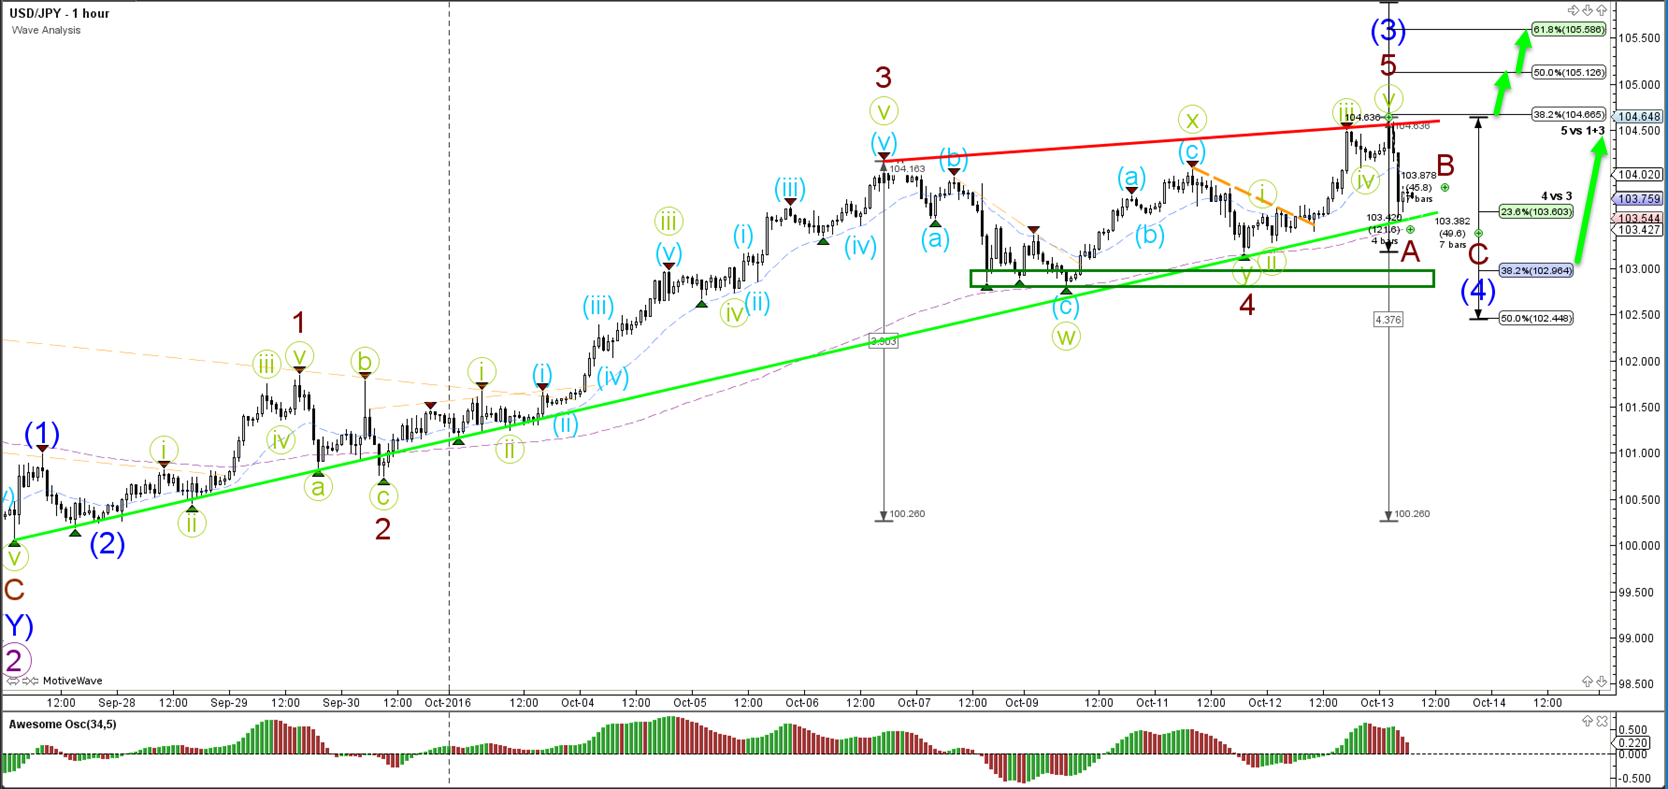
The USD/JPY broke above resistance (dotted orange) and completed a smaller 5 wave pattern (green) within waves 5 (brown/blue). For the moment a bearish ABC (brown) within wave 4 (blue) seems to be taking place unless price starts to build a triangle at the 23.6% Fibonacci and then breaks above it.


