
EUR/USD Bull-Flag Formation Vulnerable To Dovish Draghi
(Click on image to enlarge)
|
Ticker |
Last |
High |
Low |
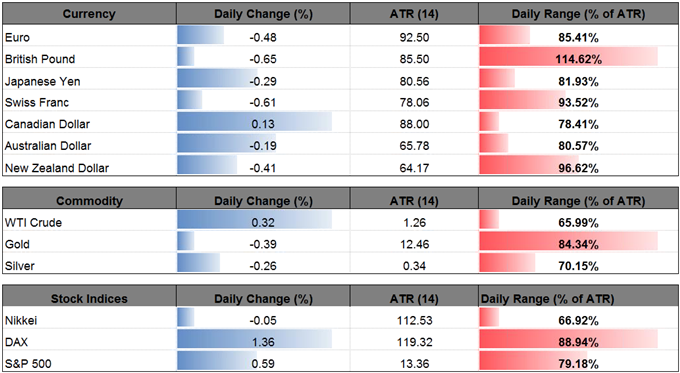
Daily Change (pip) |
Daily Range (pip) |
|
USD/CAD |
1.2542 |
1.2595 |
1.2526 |
16 |
69 |
USD/CAD extends the series of lower highs & lows carried over from the previous week, with the pair at risk of giving back the rebound from earlier this month as a continuation pattern unfolds.
The shift in USD/CAD behavior may continue to take shape in the second-half of 2017 as the 0.7% pickup in core Canada Retail Sales encourages the Bank of Canada (BoC) to further normalize monetary policy over the coming months. The comments following the July rate-hike suggests Governor Stephen Poloz and Co. are on course to implement higher borrowing-costs as ‘the output gap is now projected to close around the end of 2017, earlier than the Bank anticipated in its April Monetary Policy Report (MPR).’
In contrast, U.S. Treasury yields remain depressed, with Fed Fund Futures highlighting narrowing bets for another rate-hike in 2017 as many Federal Open Market Committee (FOMC) official ‘saw some likelihood that inflation might remain below 2 percent for longer than they currently expected, and several indicated that the risks to the inflation outlook could be tilted to the downside. The less-hawkish stance may instill a more bearish fate for the greenback especially as Chair Janet Yellen argues ‘the federal funds rate would not have to rise all that much further to get to a neutral policy stance.’
USD/CAD Daily Chart
(Click on image to enlarge)
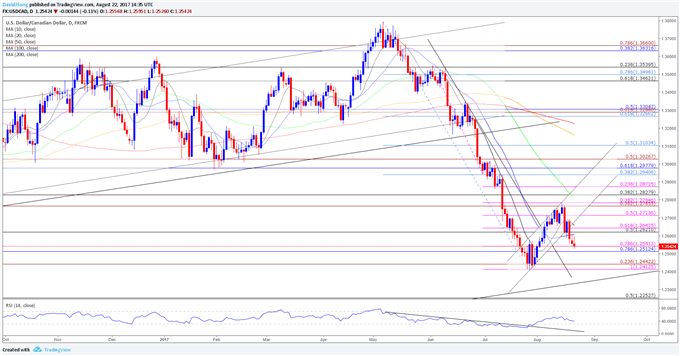
Chart - Created Using Trading View
- Downside targets are back on the radar for USD/CAD as a bear-flag unfolds after the failed attempt to clear the former-support zone around 1.2770 (38.2% expansion) to 1.2780 (38.2% expansion), with the pair extending the bearish sequence carried over from the previous.
- Need a break/close below the 1.2510 (78.6% retracement) to 1.2540 (61.8% expansion) region to open up the next downside hurdle around 1.2410 (100% expansion) to 1.2440 (23.6% expansion), which lines up with the 2017-low (1.2413).
|
Ticker |
Last |
High |
Low |
Daily Change (pip) |
Daily Range (pip) |
|
EUR/USD |
1.1758 |
1.1824 |
1.1745 |
57 |
79 |
EUR/USD holds within the previous day’s range as European Central Bank (ECB) President Mario Draghi is schedule to speak over the next two days, and the fresh rhetoric may heavily influence the near-term outlook for the single currency as the Governing Council is on course to decide the fate of the quantitative easing (QE) program in autumn.
President Draghi may merely attempt to buy more time as ‘concerns were expressed about the risk of the exchange rate overshooting in the future,’ and the central bank head may keep the door open to carry the asset-purchase program beyond the December deadline as the Governing Council struggles to achieve its one and only mandate for price stability. A slew of dovish remarks may ultimately generate a larger pullback in EUR/USD as it dampens bets for a ‘taper tantrum.’
Nevertheless, the comments may spark a bullish reaction in EUR/USD should President Draghi highlight an improved outlook for the monetary union, and the ECB may prepare European households and businesses for a less accommodative stance as officials argue the economic ‘expansion was increasingly self-sustaining and hence had become less dependent on the current degree of monetary policy accommodation.’
EUR/USD Daily Chart
(Click on image to enlarge)
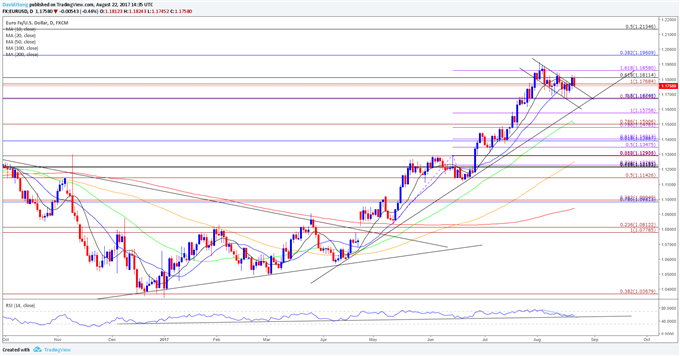
Chart - Created Using Trading View
- Even though EUR/USD fails to fill the gap from January-2015 (1.2000 down to 1.1955), topside targets remain on the radar for EUR/USD as the 1.1670 (50% retracement) region continues to offer support.
- A bull-flag formation appears to be panning out as both price and the Relative Strength Index (RSI) break out of the bearish formations from earlier this month; need a break/close back above the 1.1860 (161.8% expansion) hurdle to see a run at the August-high (1.1910),with the next region of interest coming in around 1.1960 (38.2% retracement).
Retail Sentiment
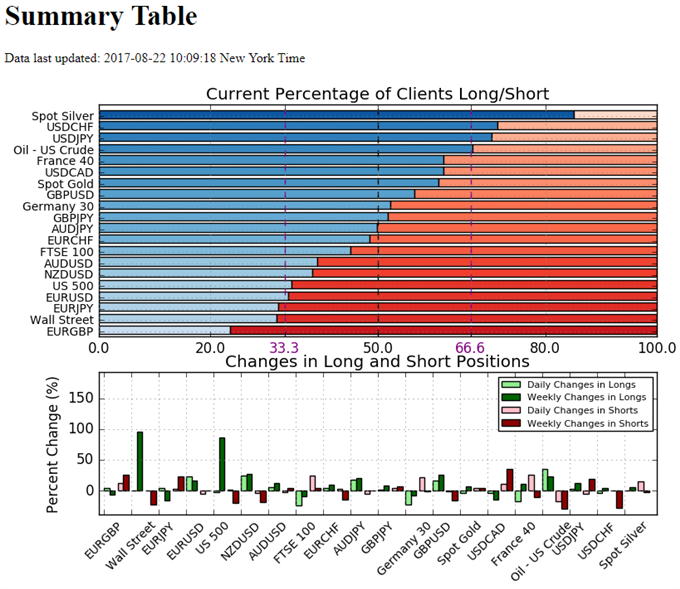
- Retail trader data shows 61.7% of traders are net-long USD/CAD with the ratio of traders long to short at 1.61 to 1. In fact, traders have remained net-long since June 07 when USD/CAD traded near 1.3446; price has moved 6.7% lower since then. The number of traders net-long is 4.3% lower than yesterday and 15.1% lower from last week, while the number of traders net-short is 10.4% higher than yesterday and 35.0% higher from last week.
- Retail trader data shows 34.0% of traders are net-long EUR/USD with the ratio of traders short to long at 1.94 to 1. In fact, traders have remained net-short since April 18 when EUR/USD traded near 1.06841; price has moved 10.0% higher since then. The number of traders net-long is 22.3% higher than yesterday and 16.4% higher from last week, while the number of traders net-short is 5.7% lower than yesterday and 0.4% higher from last week.


