
EUR/USD Bearish Break Of Rising Wedge During FOMC Statement
EUR/USD
4 hour
(Click on image to enlarge)

The EUR/USD broke the rising wedge chart pattern as mentioned in yesterday's headline. Price broke below the support trend line during the FOMC statement and interest rate decision by the Federal Reserve in the US. The bearish fall is confirming the extended WXY (red) correction within wave 4 (blue). The Fibonacci levels of wave Y (red) and wave 4 (blue) could act as potential support levels.
1 hour
(Click on image to enlarge)
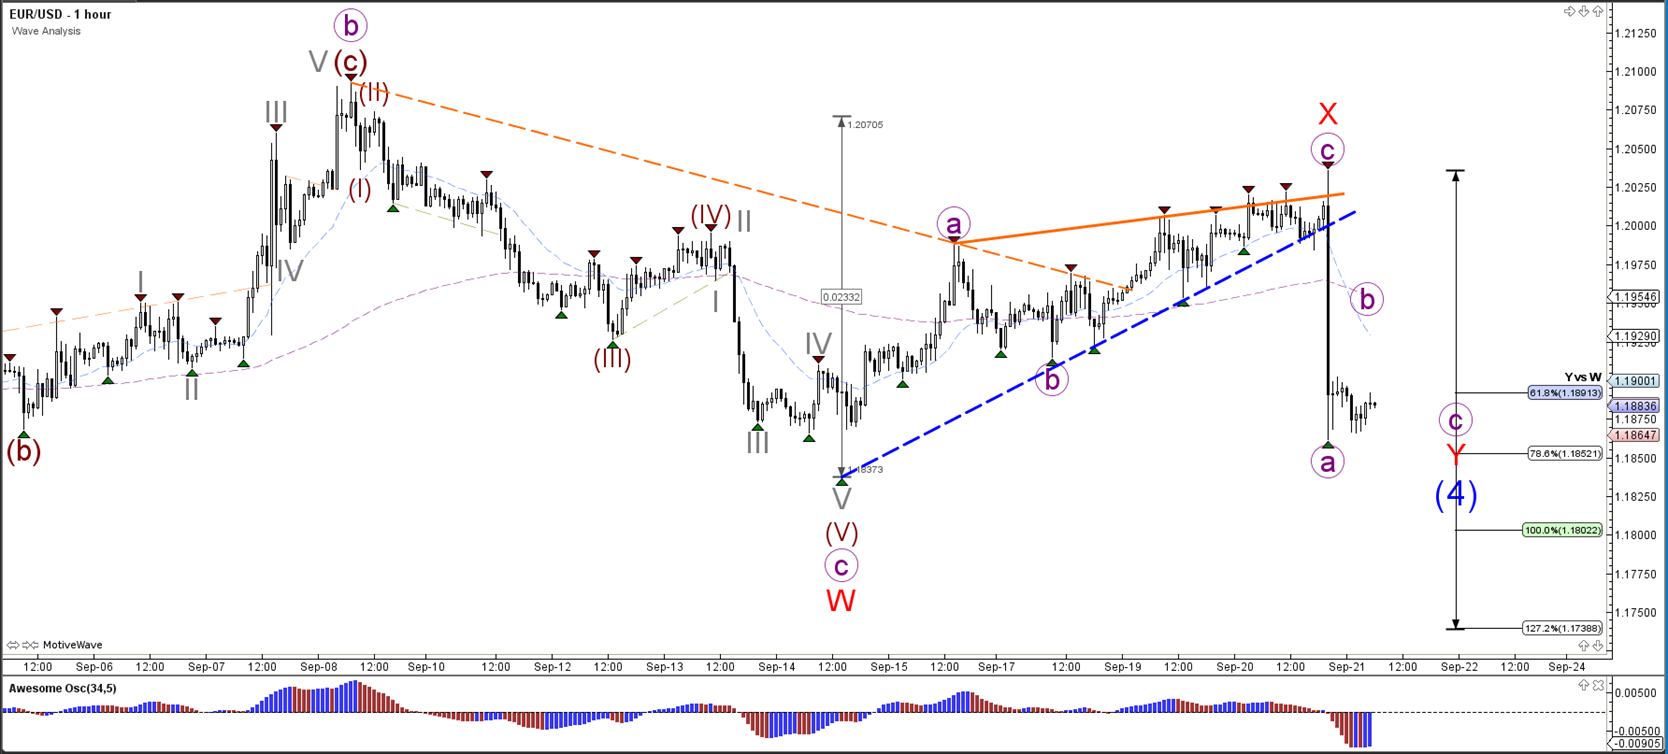
The EUR/USD break of the rising wedge chart pattern occurred with strong momentum and hence price could continue with its bearishness and build an ABC (purple) correction.
GBP/USD
4 hour
(Click on image to enlarge)

The GBP/USD made a higher high but price quickly fell back during the FOMC statement. The bullish move could have completed the wave 3 (blue) and started the wave 4 (blue) correction.
1 hour
(Click on image to enlarge)

The GBP/USD completed a ending diagonal within the last 5th wave (grey) before price fell quickly back to the support level (green). Considering the strong bearish momentum, price could continue lower via an ABC (purple) correction towards the wave 4 (blue) Fibonacci levels.
USD/JPY
4 hour
(Click on image to enlarge)

The USD/JPY received one more boost during yesterday's FOMC statement. The USD/JPY moved up strongly after bouncing at the support trend line (green). Price has reached the resistance trend line (red) again.
1 hour
(Click on image to enlarge)

The USD/JPY broke the resistance trend line (dotted orange) and is continuing with the uptrend.
Disclaimer: Trading foreign exchange or contracts for differences on margin carries a high level of risk, and may not be suitable for all investors. There is a possibility that you may sustain a ...
more

